33
/de/
AIzaSyAYiBZKx7MnpbEhh9jyipgxe19OcubqV5w
May 1, 2025
212035
Niger
NER
true
2
1
Net bilateral aid flows from DAC donors, Ireland (current US$)
2015,2014,2013,2012,2011,2010,2009,2008,2007,2006,2005,2004,2002,2000
Download
Bibliothek der Globalstatistik →Niger →

Net bilateral aid flows from DAC donors, Ireland (current US$)

Diese Statistik in anderen Ländern:

AfghanistanAlbaniaAlgeriaAngolaArab WorldArgentinaArmeniaAzerbaijanBangladeshBelarusBelizeBeninBhutanBoliviaBosnia and HerzegovinaBotswanaBrazilBulgariaBurkina FasoBurundiCambodiaCameroonCaribbean small statesCentral African RepublicCentral Europe and the BalticsChadChileChinaColombiaComorosCongo, Dem. Rep.Congo, Rep.Costa RicaCote d'IvoireCroatiaCubaCzech RepublicDjiboutiDominican RepublicEast Asia & PacificEast Asia & Pacific (excluding high income)East Asia & Pacific (IDA & IBRD countries)EcuadorEgypt, Arab Rep.El SalvadorEquatorial GuineaEritreaEthiopiaEuro areaEurope & Central AsiaEurope & Central Asia (excluding high income)Europe & Central Asia (IDA & IBRD countries)European UnionFijiFragile and conflict affected situationsGabonGambia, TheGeorgiaGhanaGrenadaGuatemalaGuineaGuinea-BissauGuyanaHaitiHeavily indebted poor countries (HIPC)High incomeHondurasHong Kong SAR, ChinaHungaryIBRD onlyIDA & IBRD totalIDA blendIDA onlyIDA totalIndiaIndonesiaIran, Islamic Rep.IraqIsraelJamaicaJordanKazakhstanKenyaKorea, Dem. People’s Rep.Korea, Rep.KosovoKyrgyz RepublicLao PDRLatin America & Caribbean Latin America & Caribbean (excluding high income)Latin America & the Caribbean (IDA & IBRD countries)LatviaLeast developed countries: UN classificationLebanonLesothoLiberiaLibyaLithuaniaLow & middle incomeLow incomeLower middle incomeMacedonia, FYRMadagascarMalawiMalaysiaMaldivesMaliMauritaniaMauritiusMexicoMicronesia, Fed. Sts.Middle East & North AfricaMiddle East & North Africa (excluding high income)Middle East & North Africa (IDA & IBRD countries)Middle incomeMoldovaMongoliaMontenegroMoroccoMozambiqueMyanmarNamibiaNepalNicaraguaNigerNigeriaOECD membersOther small statesPacific island small statesPakistanPanamaPapua New GuineaParaguayPeruPhilippinesPolandRomaniaRussian FederationRwandaSamoaSao Tome and PrincipeSenegalSerbiaSeychellesSierra LeoneSlovak RepublicSloveniaSmall statesSolomon IslandsSomaliaSouth AfricaSouth AsiaSouth Asia (IDA & IBRD)South SudanSri LankaSt. LuciaSub-Saharan Africa Sub-Saharan Africa (excluding high income)Sub-Saharan Africa (IDA & IBRD countries)SudanSurinameSwazilandSyrian Arab RepublicTajikistanTanzaniaThailandTimor-LesteTogoTrinidad and TobagoTunisiaTurkeyTurkmenistanUgandaUkraineUpper middle incomeUruguayUzbekistanVanuatuVenezuela, RBVietnamWest Bank and GazaWorldYemen, Rep.ZambiaZimbabwe

Zeitlinie:

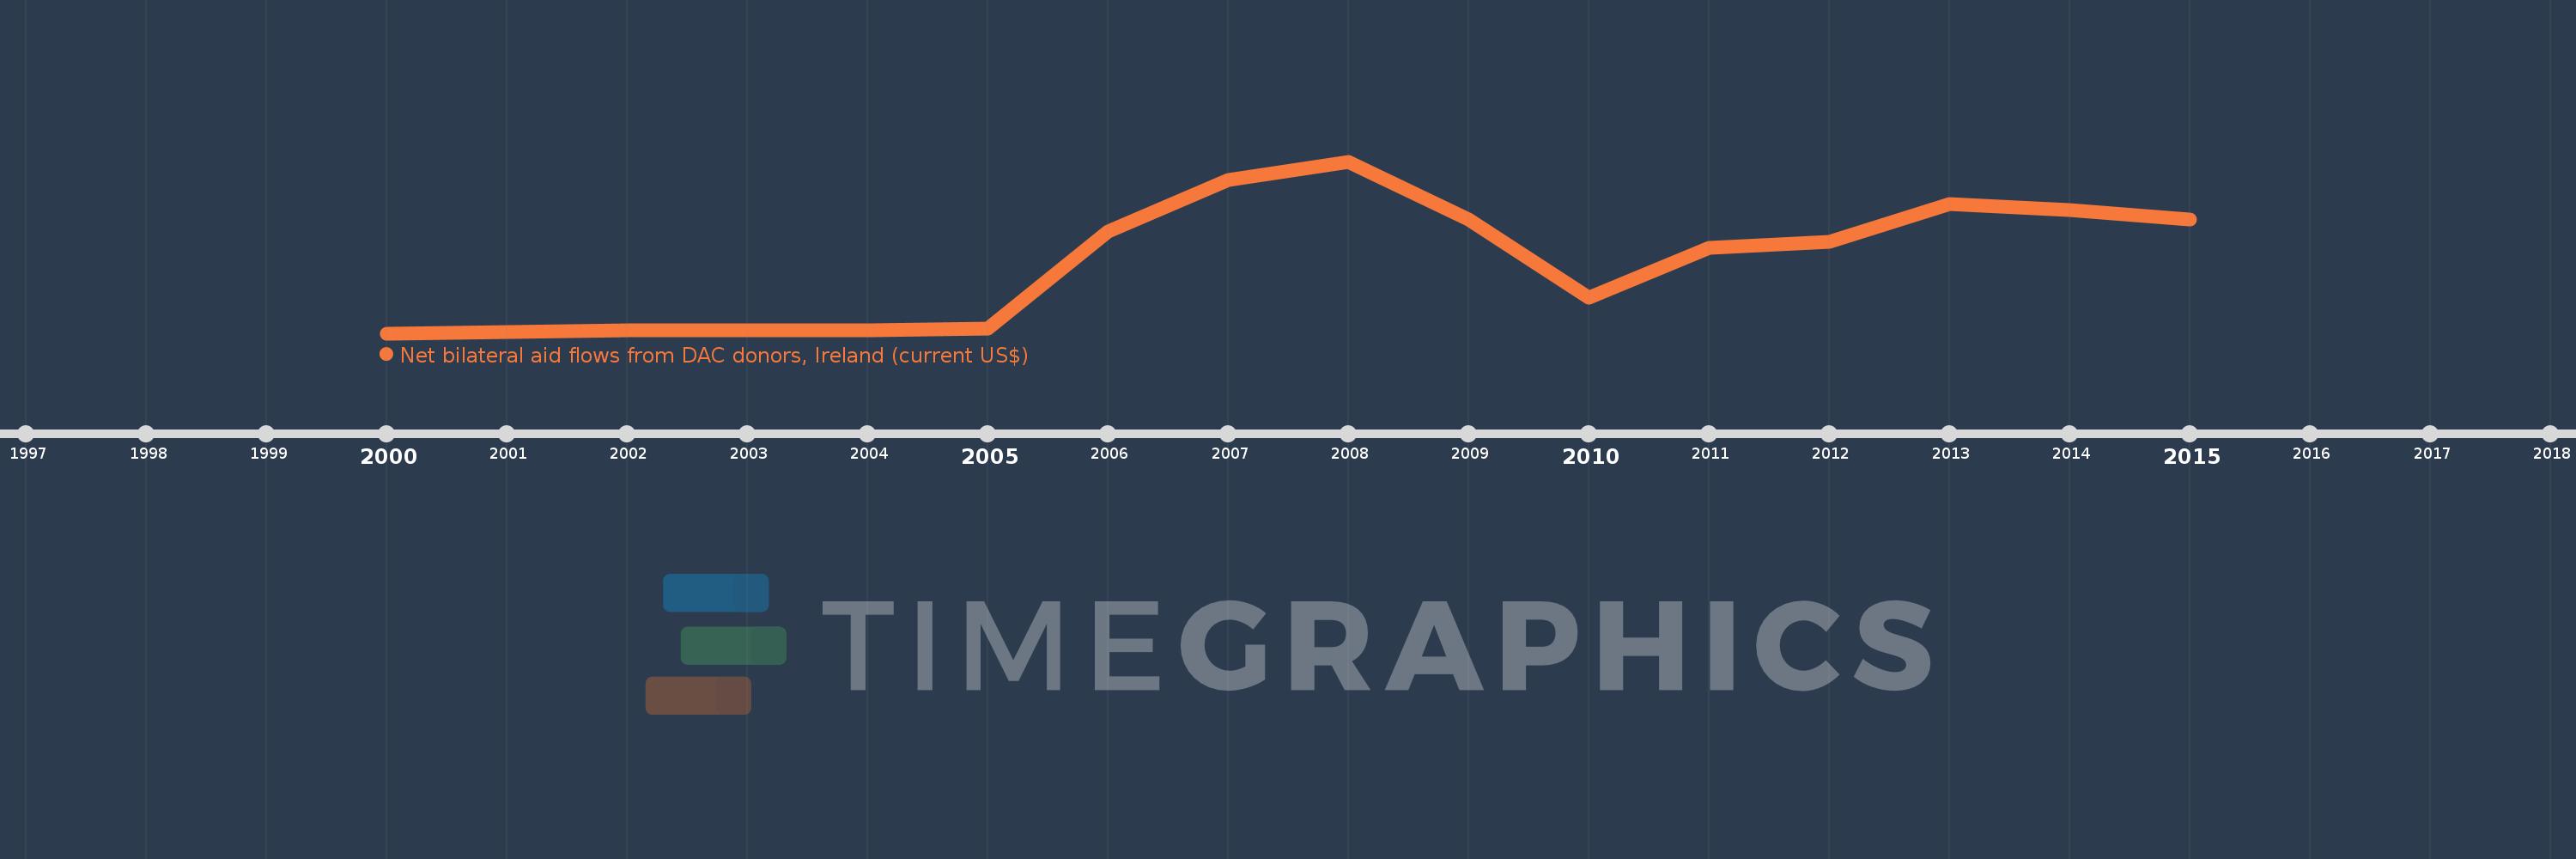
Diese Zeitleiste vorliegt die Graphik ab 2000 J. bis 2015 J. Niger. Die Angaben bis 1999 J. sind nicht vorhanden. Die Zahl aktueller Beobachtungen nach Daten: 14.

Die Quelle (Bezeichnung):

Kennzahlen der Weltentwicklung

Die Quelle (Einrichtung):

Development Assistance Committee of the Organisation for Economic Co-operation and Development, Geographical Distribution of Financial Flows to Developing Countries, Development Co-operation Report, and International Development Statistics database. Data are available online at: www.oecd.org/dac/stats/idsonline.

Kategorien:

Aid Effectiveness

Es wurde aktualisiert:

23 Apr 2017 Jahr

Kennzahlen der Wertänderungen vom Jahr zum Jahr

im Durchschnitt:
2.148 Mln.
Minimum:
40.0 Tsnd.
1 Jan 2000 Jahr
Maximum:
4.53 Mln.
1 Jan 2008 Jahr
Zum Datum der Beobachtung
Wert
Absolute Veränderung
Die Veränderung bezüglich dem vorherigen Wert
1 Jan 2000 Jahr
40.0 Tsnd.
+40.0 Tsnd.
0.0%
1 Jan 2002 Jahr
120.0 Tsnd.
+80.0 Tsnd.
200.0%
1 Jan 2004 Jahr
110.0 Tsnd.
-10.0 Tsnd.
-8.33%
1 Jan 2005 Jahr
170.0 Tsnd.
+60.0 Tsnd.
54.55%
1 Jan 2006 Jahr
2.69 Mln.
+2.52 Mln.
1.48 Tsnd.%
1 Jan 2007 Jahr
4.04 Mln.
+1.35 Mln.
50.19%
1 Jan 2008 Jahr
4.53 Mln.
+490.0 Tsnd.
12.13%
1 Jan 2009 Jahr
3.02 Mln.
-1.51 Mln.
-33.33%
1 Jan 2010 Jahr
970.0 Tsnd.
-2.05 Mln.
-67.88%
1 Jan 2011 Jahr
2.27 Mln.
+1.3 Mln.
134.02%
1 Jan 2012 Jahr
2.42 Mln.
+150.0 Tsnd.
6.61%
1 Jan 2013 Jahr
3.41 Mln.
+990.0 Tsnd.
40.91%
1 Jan 2014 Jahr
3.26 Mln.
-150.0 Tsnd.
-4.4%
1 Jan 2015 Jahr
3.02 Mln.
-240.0 Tsnd.
-7.36%

Bewertung der Länder gemäß mit laufender Statistik nach Jahren