30
/de/
AIzaSyAYiBZKx7MnpbEhh9jyipgxe19OcubqV5w
April 1, 2024
105200
Chile
CHL
true
2
1
Net bilateral aid flows from DAC donors, Ireland (current US$)
2012,2011,2010,2009,2008,2007,2006,2005,2004,2003,2002,2001,2000,1999,1996,1995,1994,1993,1992,1991,1983
Download
Bibliothek der Globalstatistik →Chile →

Net bilateral aid flows from DAC donors, Ireland (current US$)

Diese Statistik in anderen Ländern:

AfghanistanAlbaniaAlgeriaAngolaArab WorldArgentinaArmeniaAzerbaijanBangladeshBelarusBelizeBeninBhutanBoliviaBosnia and HerzegovinaBotswanaBrazilBulgariaBurkina FasoBurundiCambodiaCameroonCaribbean small statesCentral African RepublicCentral Europe and the BalticsChadChileChinaColombiaComorosCongo, Dem. Rep.Congo, Rep.Costa RicaCote d'IvoireCroatiaCubaCzech RepublicDjiboutiDominican RepublicEast Asia & PacificEast Asia & Pacific (excluding high income)East Asia & Pacific (IDA & IBRD countries)EcuadorEgypt, Arab Rep.El SalvadorEquatorial GuineaEritreaEthiopiaEuro areaEurope & Central AsiaEurope & Central Asia (excluding high income)Europe & Central Asia (IDA & IBRD countries)European UnionFijiFragile and conflict affected situationsGabonGambia, TheGeorgiaGhanaGrenadaGuatemalaGuineaGuinea-BissauGuyanaHaitiHeavily indebted poor countries (HIPC)High incomeHondurasHong Kong SAR, ChinaHungaryIBRD onlyIDA & IBRD totalIDA blendIDA onlyIDA totalIndiaIndonesiaIran, Islamic Rep.IraqIsraelJamaicaJordanKazakhstanKenyaKorea, Dem. People’s Rep.Korea, Rep.KosovoKyrgyz RepublicLao PDRLatin America & Caribbean Latin America & Caribbean (excluding high income)Latin America & the Caribbean (IDA & IBRD countries)LatviaLeast developed countries: UN classificationLebanonLesothoLiberiaLibyaLithuaniaLow & middle incomeLow incomeLower middle incomeMacedonia, FYRMadagascarMalawiMalaysiaMaldivesMaliMauritaniaMauritiusMexicoMicronesia, Fed. Sts.Middle East & North AfricaMiddle East & North Africa (excluding high income)Middle East & North Africa (IDA & IBRD countries)Middle incomeMoldovaMongoliaMontenegroMoroccoMozambiqueMyanmarNamibiaNepalNicaraguaNigerNigeriaOECD membersOther small statesPacific island small statesPakistanPanamaPapua New GuineaParaguayPeruPhilippinesPolandRomaniaRussian FederationRwandaSamoaSao Tome and PrincipeSenegalSerbiaSeychellesSierra LeoneSlovak RepublicSloveniaSmall statesSolomon IslandsSomaliaSouth AfricaSouth AsiaSouth Asia (IDA & IBRD)South SudanSri LankaSt. LuciaSub-Saharan Africa Sub-Saharan Africa (excluding high income)Sub-Saharan Africa (IDA & IBRD countries)SudanSurinameSwazilandSyrian Arab RepublicTajikistanTanzaniaThailandTimor-LesteTogoTrinidad and TobagoTunisiaTurkeyTurkmenistanUgandaUkraineUpper middle incomeUruguayUzbekistanVanuatuVenezuela, RBVietnamWest Bank and GazaWorldYemen, Rep.ZambiaZimbabwe

Zeitlinie:

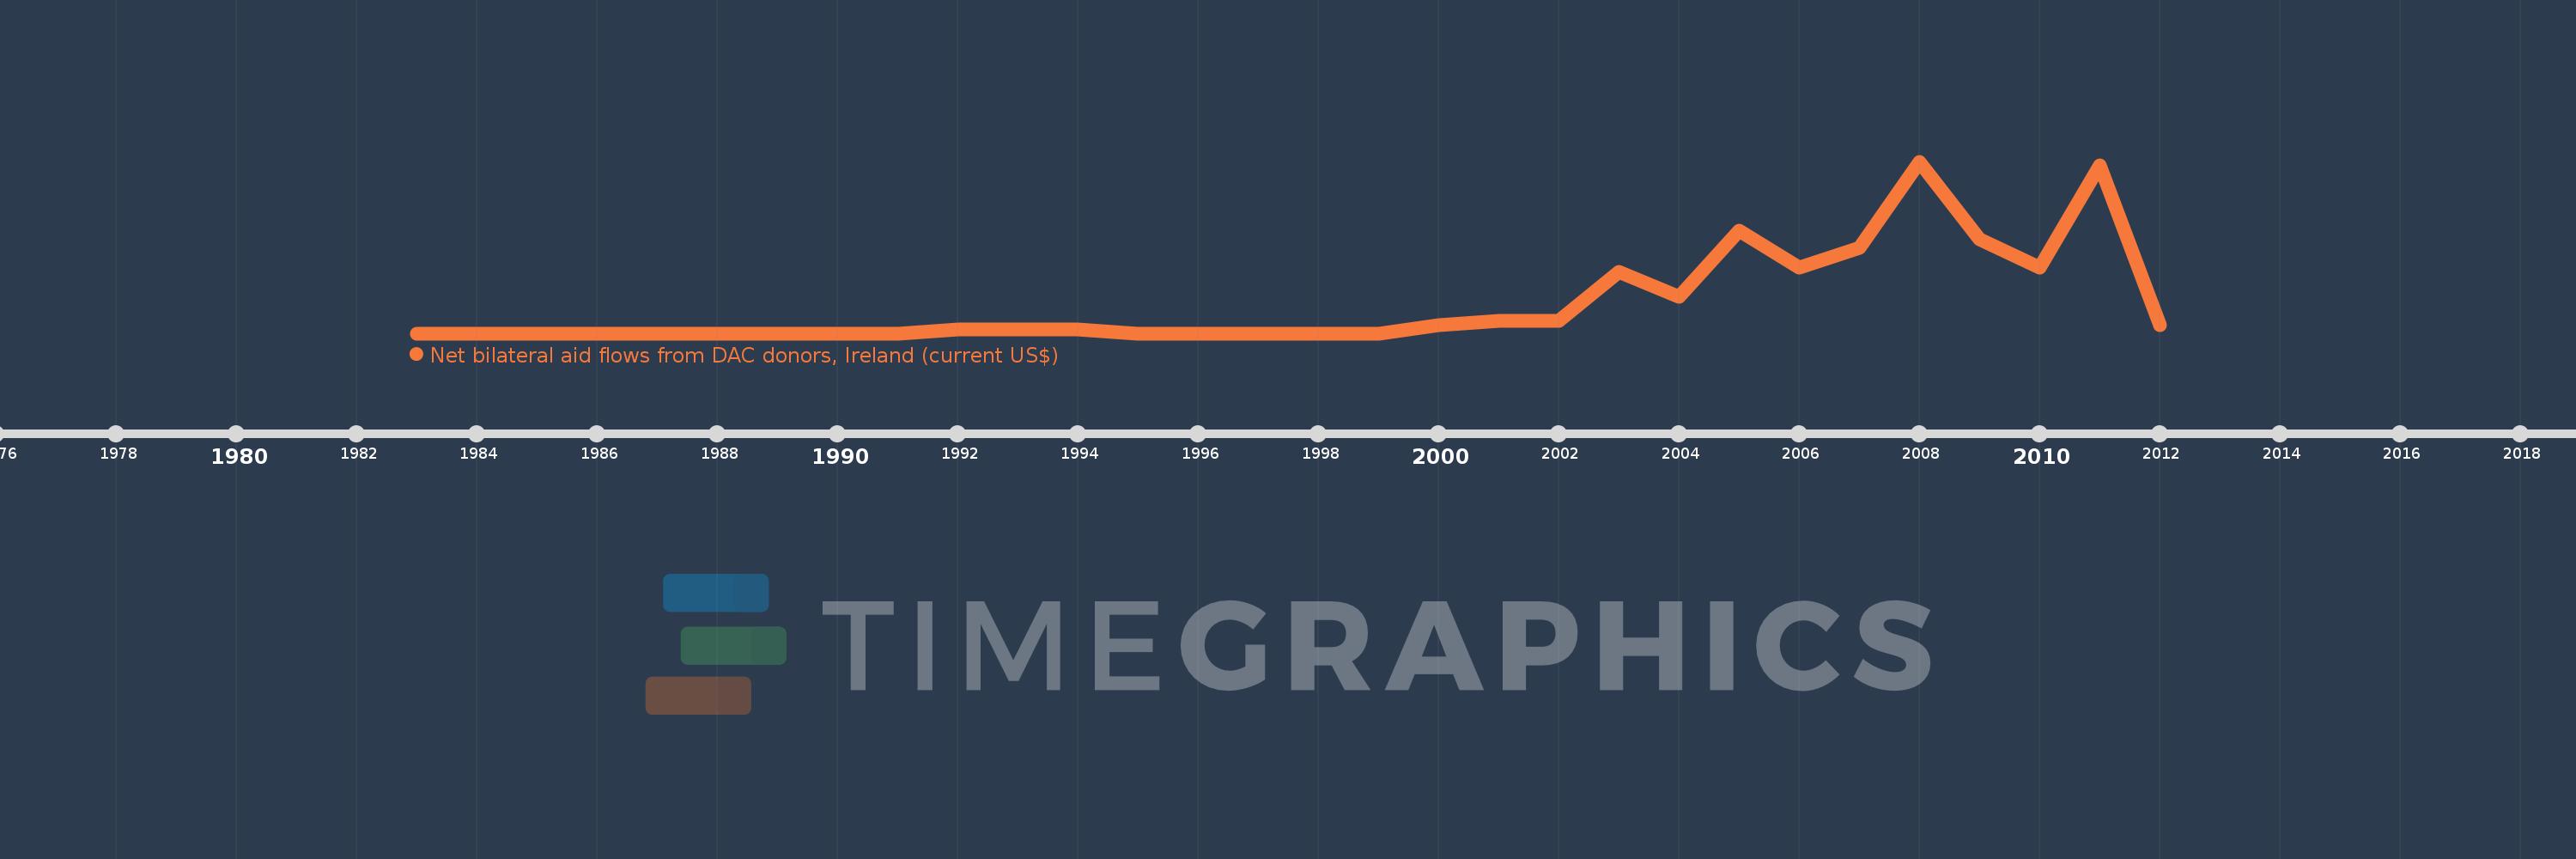
Diese Zeitleiste vorliegt die Graphik ab 1983 J. bis 2012 J. Chile. Die Angaben bis 1982 J. sind nicht vorhanden. Die Zahl aktueller Beobachtungen nach Daten: 21.

Die Quelle (Bezeichnung):

Kennzahlen der Weltentwicklung

Die Quelle (Einrichtung):

Development Assistance Committee of the Organisation for Economic Co-operation and Development, Geographical Distribution of Financial Flows to Developing Countries, Development Co-operation Report, and International Development Statistics database. Data are available online at: www.oecd.org/dac/stats/idsonline.

Kategorien:

Aid Effectiveness

Es wurde aktualisiert:

23 Apr 2017 Jahr

Kennzahlen der Wertänderungen vom Jahr zum Jahr

im Durchschnitt:
115.238 Tsnd.
Minimum:
10.0 Tsnd.
1 Jan 1983 Jahr
Maximum:
430.0 Tsnd.
1 Jan 2008 Jahr
Zum Datum der Beobachtung
Wert
Absolute Veränderung
Die Veränderung bezüglich dem vorherigen Wert
1 Jan 1983 Jahr
10.0 Tsnd.
+10.0 Tsnd.
0.0%
1 Jan 1991 Jahr
10.0 Tsnd.
0.0
0.0%
1 Jan 1992 Jahr
20.0 Tsnd.
+10.0 Tsnd.
100.0%
1 Jan 1993 Jahr
20.0 Tsnd.
0.0
0.0%
1 Jan 1994 Jahr
20.0 Tsnd.
0.0
0.0%
1 Jan 1995 Jahr
10.0 Tsnd.
-10.0 Tsnd.
-50.0%
1 Jan 1996 Jahr
10.0 Tsnd.
0.0
0.0%
1 Jan 1999 Jahr
10.0 Tsnd.
0.0
0.0%
1 Jan 2000 Jahr
30.0 Tsnd.
+20.0 Tsnd.
200.0%
1 Jan 2001 Jahr
40.0 Tsnd.
+10.0 Tsnd.
33.33%
1 Jan 2002 Jahr
40.0 Tsnd.
0.0
0.0%
1 Jan 2003 Jahr
160.0 Tsnd.
+120.0 Tsnd.
300.0%
1 Jan 2004 Jahr
100.0 Tsnd.
-60.0 Tsnd.
-37.5%
1 Jan 2005 Jahr
260.0 Tsnd.
+160.0 Tsnd.
160.0%
1 Jan 2006 Jahr
170.0 Tsnd.
-90.0 Tsnd.
-34.62%
1 Jan 2007 Jahr
220.0 Tsnd.
+50.0 Tsnd.
29.41%
1 Jan 2008 Jahr
430.0 Tsnd.
+210.0 Tsnd.
95.45%
1 Jan 2009 Jahr
240.0 Tsnd.
-190.0 Tsnd.
-44.19%
1 Jan 2010 Jahr
170.0 Tsnd.
-70.0 Tsnd.
-29.17%
1 Jan 2011 Jahr
420.0 Tsnd.
+250.0 Tsnd.
147.06%
1 Jan 2012 Jahr
30.0 Tsnd.
-390.0 Tsnd.
-92.86%

Bewertung der Länder gemäß mit laufender Statistik nach Jahren