29
/de/
de
AIzaSyAYiBZKx7MnpbEhh9jyipgxe19OcubqV5w
April 1, 2024
174903
Lao PDR
LAO
true
2
1
Trained teachers in preprimary education (% of total teachers)
2015,2014,2013,2012,2011,2010,2009,2008,2007,2006,2005,2004,2003,2002,2001,2000
Download
Bibliothek der Globalstatistik →Lao PDR →

Trained teachers in preprimary education (% of total teachers)

Diese Statistik in anderen Ländern:
AndorraAngolaAntigua and BarbudaArab WorldArmeniaArubaAzerbaijanBahamas, TheBahrainBarbadosBelarusBelizeBeninBermudaBhutanBoliviaBotswanaBritish Virgin IslandsBrunei DarussalamBurkina FasoBurundiCabo VerdeCambodiaCameroonCaribbean small statesCayman IslandsChadColombiaCongo, Dem. Rep.Congo, Rep.Costa RicaCote d'IvoireCroatiaCubaDjiboutiDominicaDominican RepublicEcuadorEgypt, Arab Rep.El SalvadorEritreaEthiopiaFragile and conflict affected situationsGambia, TheGeorgiaGhanaGibraltarGrenadaGuineaGuinea-BissauGuyanaHeavily indebted poor countries (HIPC)HondurasIDA blendIDA onlyIDA totalIran, Islamic Rep.IraqKazakhstanKenyaKuwaitKyrgyz RepublicLao PDRLatin America & Caribbean Latin America & Caribbean (excluding high income)Latin America & the Caribbean (IDA & IBRD countries)Least developed countries: UN classificationLebanonLiberiaLow incomeMacao SAR, ChinaMadagascarMalaysiaMaldivesMaliMarshall IslandsMauritaniaMauritiusMexicoMiddle East & North AfricaMiddle East & North Africa (excluding high income)Middle East & North Africa (IDA & IBRD countries)MoldovaMongoliaMoroccoMyanmarNamibiaNauruNepalNicaraguaNigerOmanOther small statesPacific island small statesPanamaParaguayPre-demographic dividendQatarRwandaSamoaSao Tome and PrincipeSaudi ArabiaSenegalSerbiaSeychellesSierra LeoneSmall statesSolomon IslandsSouth AfricaSouth SudanSt. Kitts and NevisSt. LuciaSt. Vincent and the GrenadinesSub-Saharan Africa Sub-Saharan Africa (excluding high income)Sub-Saharan Africa (IDA & IBRD countries)SurinameSwazilandSyrian Arab RepublicTajikistanTanzaniaTogoTongaTrinidad and TobagoTunisiaTuvaluUnited Arab EmiratesUzbekistanVanuatuVietnamWest Bank and GazaZimbabwe
Zeitlinie:
Diese Zeitleiste vorliegt die Graphik ab 2000 J. bis 2015 J. Lao PDR. Die Angaben bis 1999 J. sind nicht vorhanden. Die Zahl aktueller Beobachtungen nach Daten: 16.
Die Quelle (Bezeichnung):
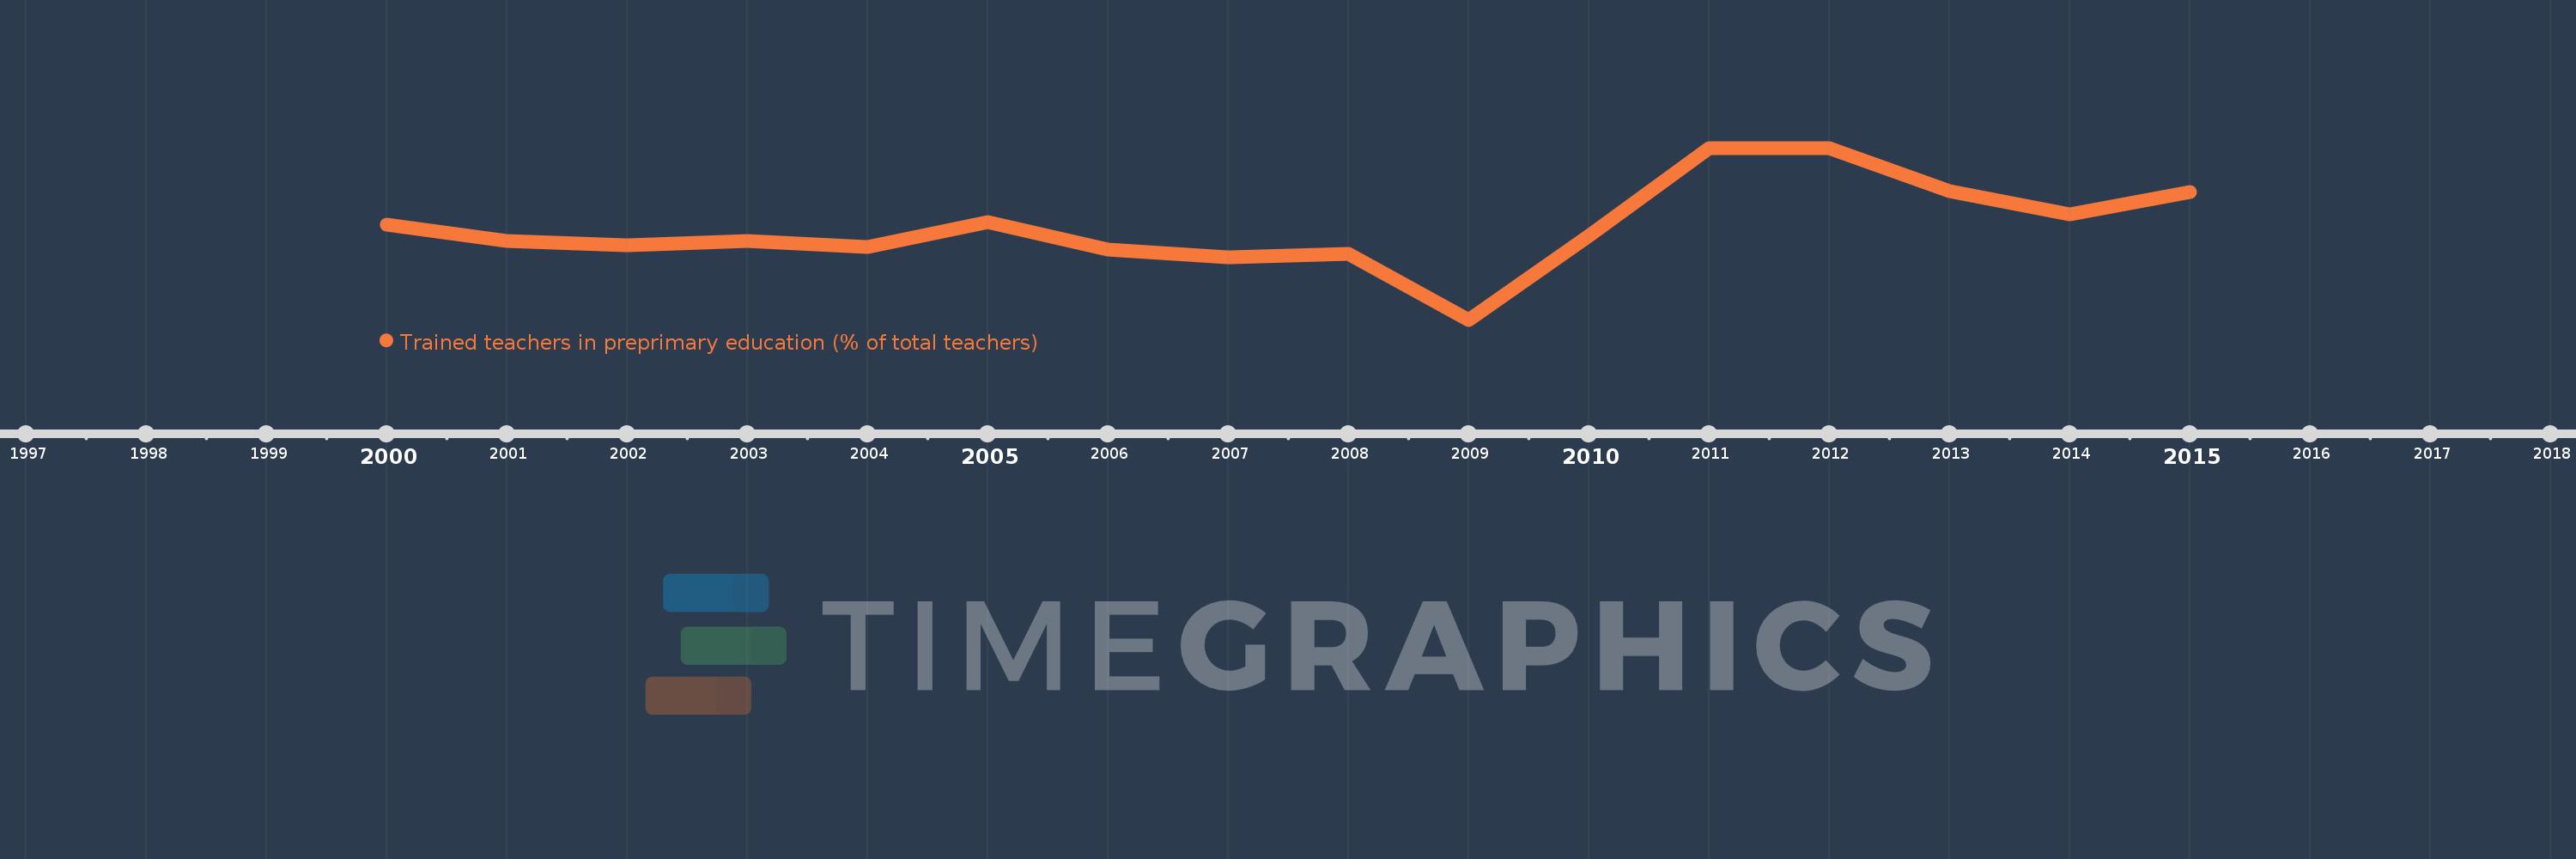
Kennzahlen der Weltentwicklung
Die Quelle (Einrichtung):
United Nations Educational, Scientific, and Cultural Organization (UNESCO) Institute for Statistics.
Kategorien:
Education
Es wurde aktualisiert:
23 Apr 2017 Jahr
Kennzahlen der Wertänderungen vom Jahr zum Jahr
im Durchschnitt:
85.225
Minimum:
70.842
1 Jan 2009 Jahr
Maximum:
97.458
1 Jan 2011 Jahr
Zum Datum der Beobachtung
Wert
Absolute Veränderung
Die Veränderung bezüglich dem vorherigen Wert
1 Jan 2000 Jahr
85.571
+85.571
0.0%
1 Jan 2001 Jahr
83.084
-2.488
-2.91%
1 Jan 2002 Jahr
82.382
-0.702
-0.85%
1 Jan 2003 Jahr
83.039
+0.657
0.8%
1 Jan 2004 Jahr
82.162
-0.876
-1.06%
1 Jan 2005 Jahr
85.959
+3.797
4.62%
1 Jan 2006 Jahr
81.766
-4.194
-4.88%
1 Jan 2007 Jahr
80.454
-1.312
-1.6%
1 Jan 2008 Jahr
81.034
+0.581
0.72%
1 Jan 2009 Jahr
70.842
-10.192
-12.58%
1 Jan 2010 Jahr
83.816
+12.973
18.31%
1 Jan 2011 Jahr
97.458
+13.642
16.28%
1 Jan 2012 Jahr
97.428
-0.03
-0.03%
1 Jan 2013 Jahr
90.744
-6.684
-6.86%
1 Jan 2014 Jahr
87.221
-3.522
-3.88%
1 Jan 2015 Jahr
90.635
+3.413
3.91%
Bewertung der Länder gemäß mit laufender Statistik nach Jahren

Kommentare:

Abschicken
PremiumAbout & FeedbackVereinbarungPrivatheit
logo
© 2022 Selected Technologies LLC – Morgan Hill, California