33
/de/
AIzaSyAYiBZKx7MnpbEhh9jyipgxe19OcubqV5w
August 1, 2025
173649
Kyrgyz Republic
KGZ
true
2
1
Trained teachers in preprimary education (% of total teachers)
2012,2011,2010,2009,2008,2007,2006,2005,2004,2003,2002,2001,2000
Download
Bibliothek der Globalstatistik →Kyrgyz Republic →

Trained teachers in preprimary education (% of total teachers)

Diese Statistik in anderen Ländern:

AndorraAngolaAntigua and BarbudaArab WorldArmeniaArubaAzerbaijanBahamas, TheBahrainBarbadosBelarusBelizeBeninBermudaBhutanBoliviaBotswanaBritish Virgin IslandsBrunei DarussalamBurkina FasoBurundiCabo VerdeCambodiaCameroonCaribbean small statesCayman IslandsChadColombiaCongo, Dem. Rep.Congo, Rep.Costa RicaCote d'IvoireCroatiaCubaDjiboutiDominicaDominican RepublicEcuadorEgypt, Arab Rep.El SalvadorEritreaEthiopiaFragile and conflict affected situationsGambia, TheGeorgiaGhanaGibraltarGrenadaGuineaGuinea-BissauGuyanaHeavily indebted poor countries (HIPC)HondurasIDA blendIDA onlyIDA totalIran, Islamic Rep.IraqKazakhstanKenyaKuwaitKyrgyz RepublicLao PDRLatin America & Caribbean Latin America & Caribbean (excluding high income)Latin America & the Caribbean (IDA & IBRD countries)Least developed countries: UN classificationLebanonLiberiaLow incomeMacao SAR, ChinaMadagascarMalaysiaMaldivesMaliMarshall IslandsMauritaniaMauritiusMexicoMiddle East & North AfricaMiddle East & North Africa (excluding high income)Middle East & North Africa (IDA & IBRD countries)MoldovaMongoliaMoroccoMyanmarNamibiaNauruNepalNicaraguaNigerOmanOther small statesPacific island small statesPanamaParaguayPre-demographic dividendQatarRwandaSamoaSao Tome and PrincipeSaudi ArabiaSenegalSerbiaSeychellesSierra LeoneSmall statesSolomon IslandsSouth AfricaSouth SudanSt. Kitts and NevisSt. LuciaSt. Vincent and the GrenadinesSub-Saharan Africa Sub-Saharan Africa (excluding high income)Sub-Saharan Africa (IDA & IBRD countries)SurinameSwazilandSyrian Arab RepublicTajikistanTanzaniaTogoTongaTrinidad and TobagoTunisiaTuvaluUnited Arab EmiratesUzbekistanVanuatuVietnamWest Bank and GazaZimbabwe

Zeitlinie:

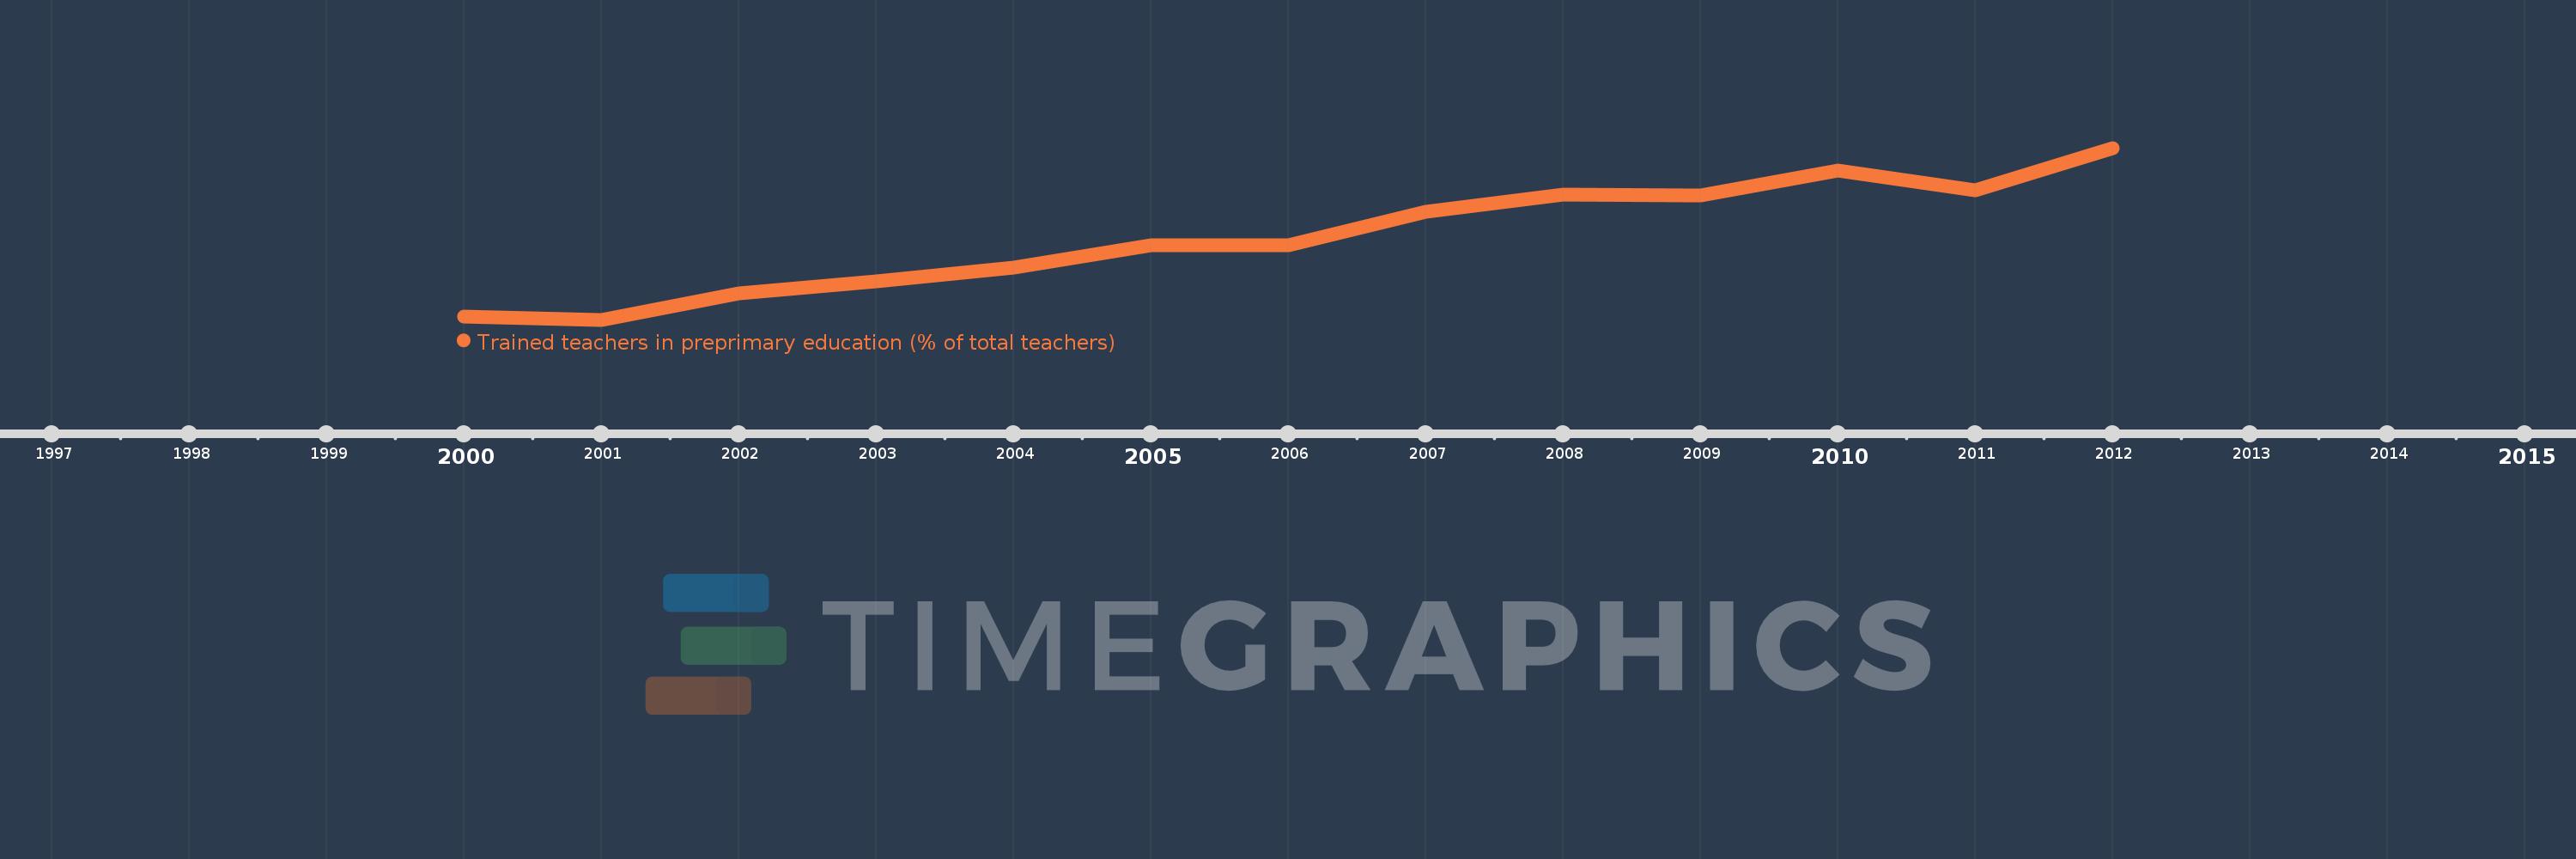
Diese Zeitleiste vorliegt die Graphik ab 2000 J. bis 2012 J. Kyrgyz Republic. Die Angaben bis 1999 J. sind nicht vorhanden. Die Zahl aktueller Beobachtungen nach Daten: 13.

Die Quelle (Bezeichnung):

Kennzahlen der Weltentwicklung

Die Quelle (Einrichtung):

United Nations Educational, Scientific, and Cultural Organization (UNESCO) Institute for Statistics.

Kategorien:

Education

Es wurde aktualisiert:

23 Apr 2017 Jahr

Kennzahlen der Wertänderungen vom Jahr zum Jahr

im Durchschnitt:
38.884
Minimum:
32.111
1 Jan 2001 Jahr
Maximum:
46.161
1 Jan 2012 Jahr
Zum Datum der Beobachtung
Wert
Absolute Veränderung
Die Veränderung bezüglich dem vorherigen Wert
1 Jan 2000 Jahr
32.399
+32.399
0.0%
1 Jan 2001 Jahr
32.111
-0.288
-0.89%
1 Jan 2002 Jahr
34.242
+2.13
6.63%
1 Jan 2003 Jahr
35.224
+0.982
2.87%
1 Jan 2004 Jahr
36.372
+1.148
3.26%
1 Jan 2005 Jahr
38.213
+1.841
5.06%
1 Jan 2006 Jahr
38.234
+0.021
0.05%
1 Jan 2007 Jahr
40.955
+2.721
7.12%
1 Jan 2008 Jahr
42.323
+1.369
3.34%
1 Jan 2009 Jahr
42.262
-0.061
-0.15%
1 Jan 2010 Jahr
44.302
+2.04
4.83%
1 Jan 2011 Jahr
42.694
-1.608
-3.63%
1 Jan 2012 Jahr
46.161
+3.467
8.12%

Bewertung der Länder gemäß mit laufender Statistik nach Jahren