29
/
en
AIzaSyAYiBZKx7MnpbEhh9jyipgxe19OcubqV5w
April 1, 2024
98948
Cambodia
KHM
true
2
1
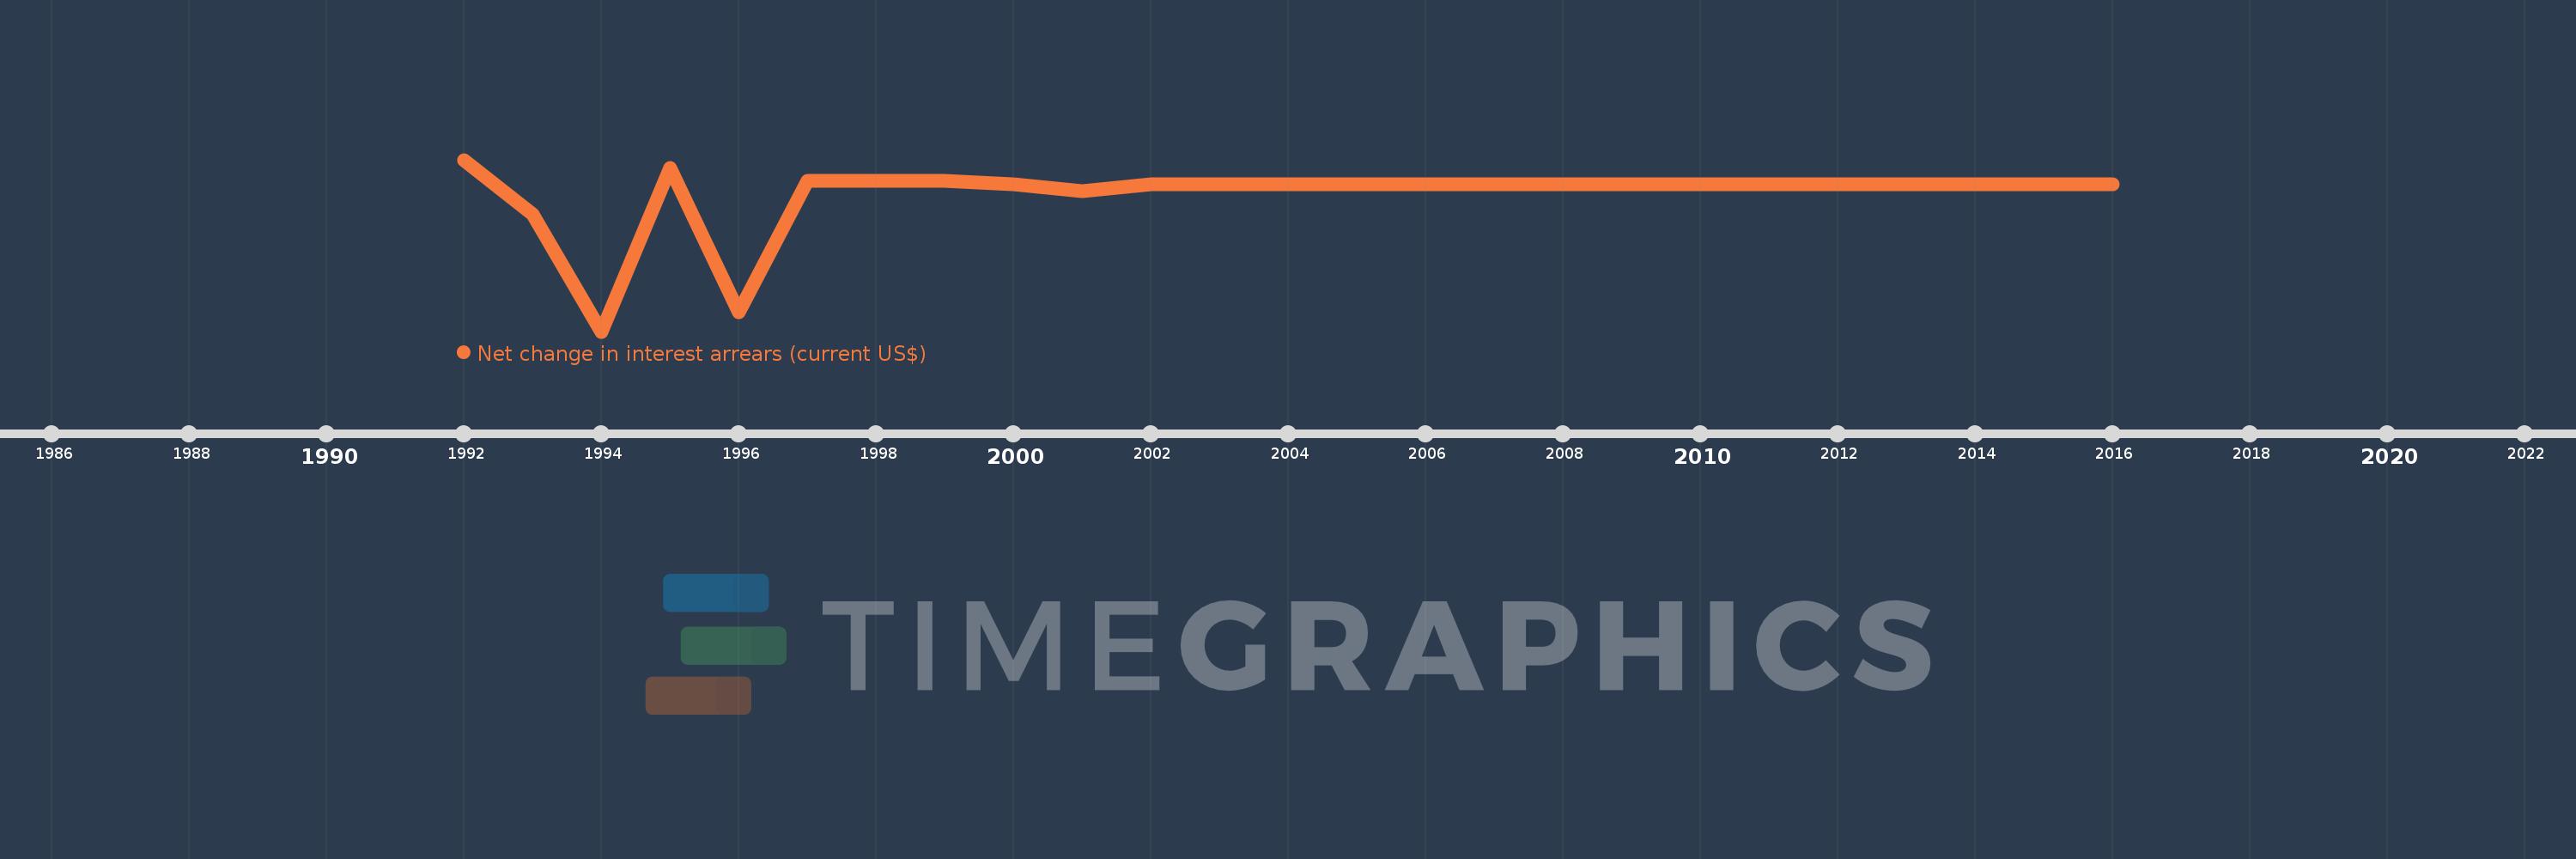
Net change in interest arrears (current US$)
2016,2015,2014,2013,2012,2011,2010,2009,2008,2007,2006,2005,2004,2003,2002,2001,2000,1999,1998,1997,1996,1995,1994,1993,1992
This statistics in other country:
Timeline:
This timeline shows a graph from 1992 to 2016 of Cambodia. No data until 1991. Number of actual observations by date: 25.
Source name:
World Development Indicators
Source organization:
World Bank, International Debt Statistics.
Categories, topics:
External Debt
Last updated:
apr 23, 2017
Indicators value changes by year
Minimum:
-16.482 mln
jan 1, 1994
Maximum:
2.698 mln
jan 1, 1992
At the date of observation
Value
Absolute change
Change from previous value
jan 1, 1992
2.698 mln
+2.698 mln
0.0%
jan 1, 1993
-3.36 mln
-6.058 mln
-224.54%
jan 1, 1994
-16.482 mln
-13.122 mln
390.54%
jan 1, 1995
1.767 mln
+18.249 mln
-110.72%
jan 1, 1996
-14.309 mln
-16.076 mln
-909.79%
jan 1, 1997
319.0K
+14.628 mln
-102.23%
jan 1, 1998
341.0K
+22.0K
6.9%
jan 1, 1999
303.0K
-38.0K
-11.14%
jan 1, 2000
-59.0K
-362.0K
-119.47%
jan 1, 2001
-827.0K
-768.0K
1.3K%
jan 1, 2002
2.0K
+829.0K
-100.24%
jan 1, 2003
-30.0K
-32.0K
-1.6K%
jan 1, 2004
-9.0K
+21.0K
-70.0%
jan 1, 2005
-8.0K
+1000.0
-11.11%
jan 1, 2006
-14.0K
-6.0K
75.0%
jan 1, 2007
-2.0K
+12.0K
-85.71%
jan 1, 2008
-16.0K
-14.0K
700.0%
jan 1, 2009
0.0
+16.0K
-100.0%
Ranking of countries by current statistics by years


Comments: