29
/
en
AIzaSyAYiBZKx7MnpbEhh9jyipgxe19OcubqV5w
April 1, 2024
121228
Dominica
DMA
true
2
1
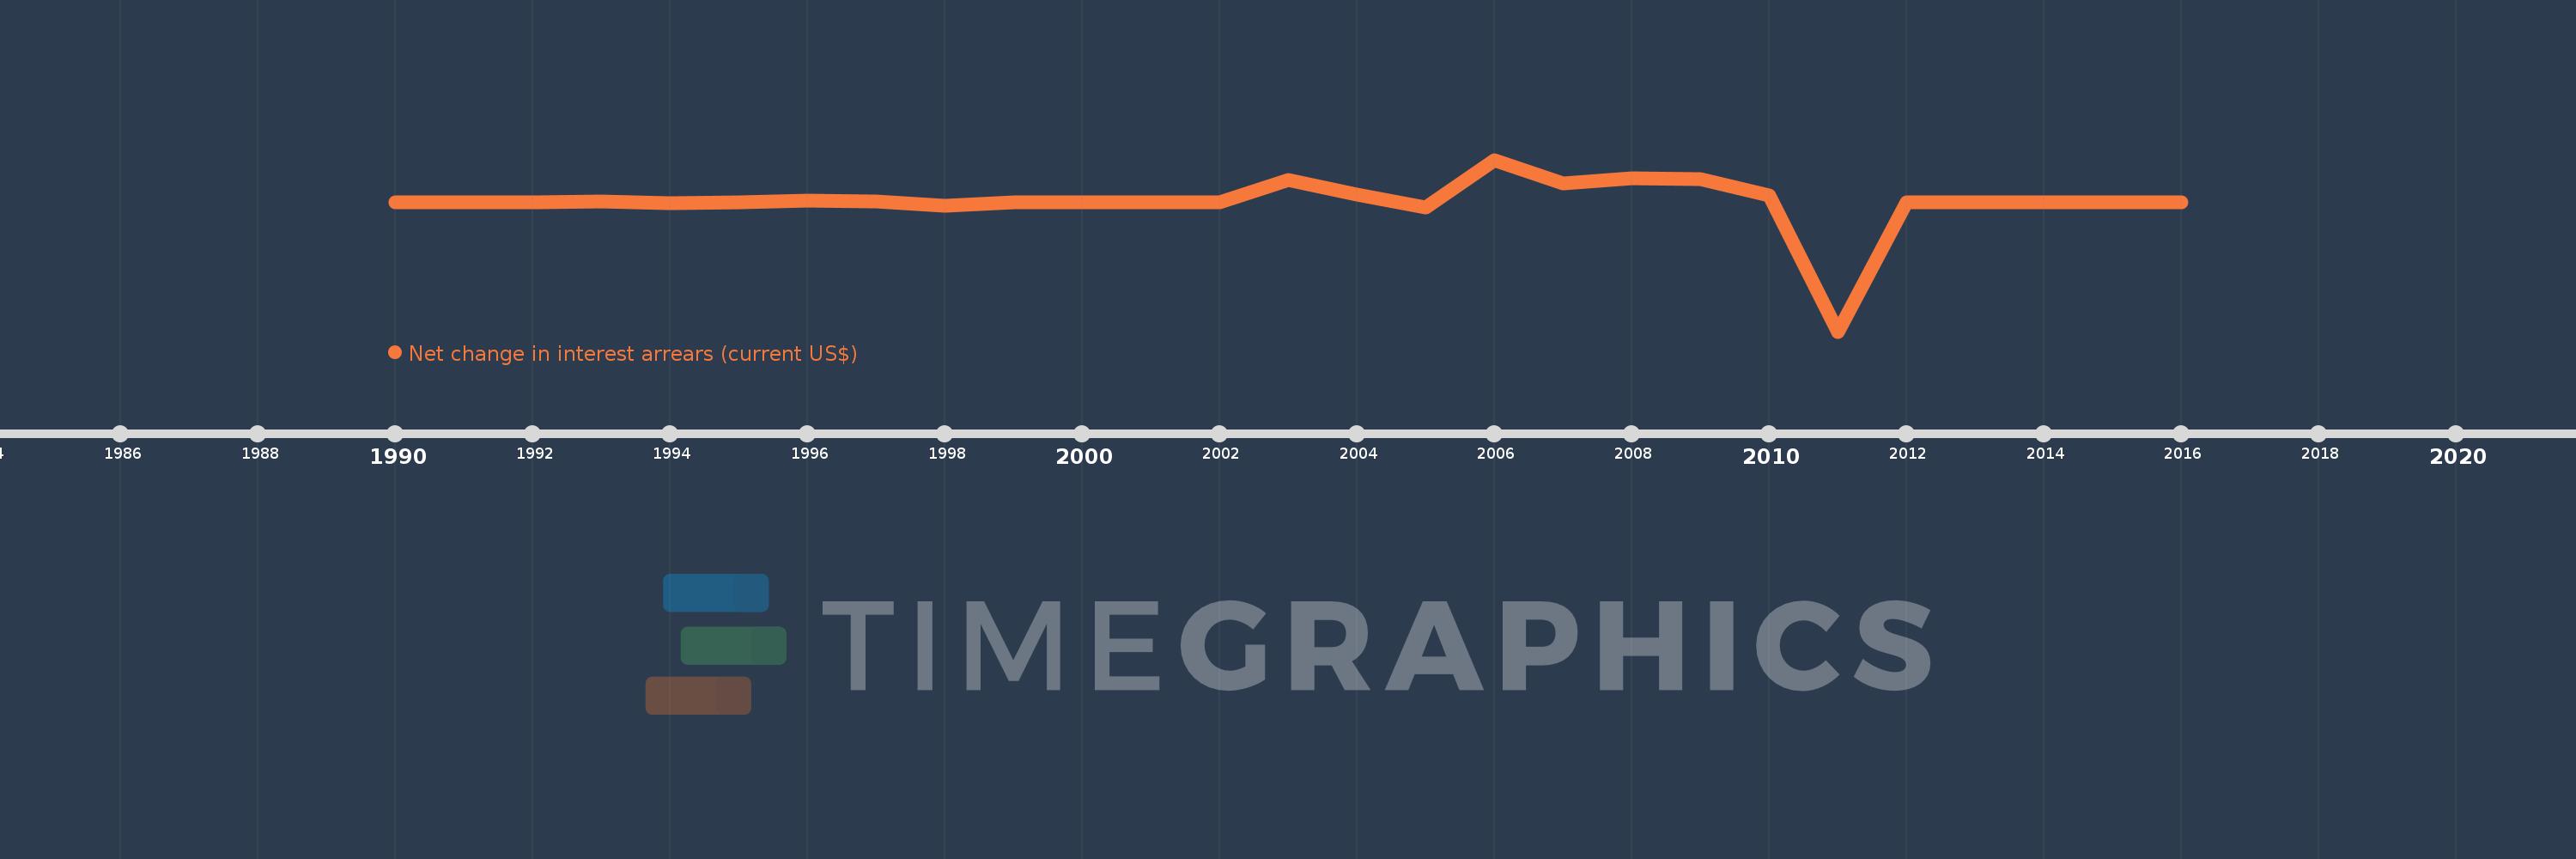
Net change in interest arrears (current US$)
2016,2015,2014,2013,2012,2011,2010,2009,2008,2007,2006,2005,2004,2003,2002,2001,2000,1999,1998,1997,1996,1995,1994,1993,1992,1991,1990
This statistics in other country:
Timeline:
This timeline shows a graph from 1990 to 2016 of Dominica. No data until 1989. Number of actual observations by date: 27.
Source name:
World Development Indicators
Source organization:
World Bank, International Debt Statistics.
Categories, topics:
External Debt
Last updated:
apr 23, 2017
Indicators value changes by year
Minimum:
-16.462 mln
jan 1, 2011
Maximum:
5.414 mln
jan 1, 2006
At the date of observation
Value
Absolute change
Change from previous value
jan 1, 1990
-2.0K
-2.0K
0.0%
jan 1, 1991
20.0K
+22.0K
-1.1K%
jan 1, 1992
29.0K
+9.0K
45.0%
jan 1, 1993
63.0K
+34.0K
117.24%
jan 1, 1994
-103.0K
-166.0K
-263.49%
jan 1, 1995
3.0K
+106.0K
-102.91%
jan 1, 1996
252.0K
+249.0K
8.3K%
jan 1, 1997
149.0K
-103.0K
-40.87%
jan 1, 1998
-412.0K
-561.0K
-376.51%
jan 1, 1999
30.0K
+442.0K
-107.28%
jan 1, 2000
2.0K
-28.0K
-93.33%
jan 1, 2001
-30.0K
-32.0K
-1.6K%
jan 1, 2002
10.0K
+40.0K
-133.33%
jan 1, 2003
2.83 mln
+2.82 mln
28.2K%
jan 1, 2004
977.0K
-1.853 mln
-65.48%
jan 1, 2005
-671.0K
-1.648 mln
-168.68%
jan 1, 2006
5.414 mln
+6.085 mln
-906.86%
jan 1, 2007
2.44 mln
-2.974 mln
-54.93%
jan 1, 2008
3.039 mln
+599.0K
24.55%
jan 1, 2009
3.006 mln
-33.0K
-1.09%
jan 1, 2010
894.0K
-2.112 mln
-70.26%
jan 1, 2011
-16.462 mln
-17.356 mln
-1.94K%
jan 1, 2012
0.0
+16.462 mln
-100.0%
jan 1, 2014
23.0K
+23.0K
%
jan 1, 2015
1000.0
-22.0K
-95.65%
jan 1, 2016
-26.0K
-27.0K
-2.7K%
Ranking of countries by current statistics by years


Comments: