29
/
en
AIzaSyAYiBZKx7MnpbEhh9jyipgxe19OcubqV5w
April 1, 2024
31896
Europe & Central Asia (excluding high income)
ECA
false
2
1
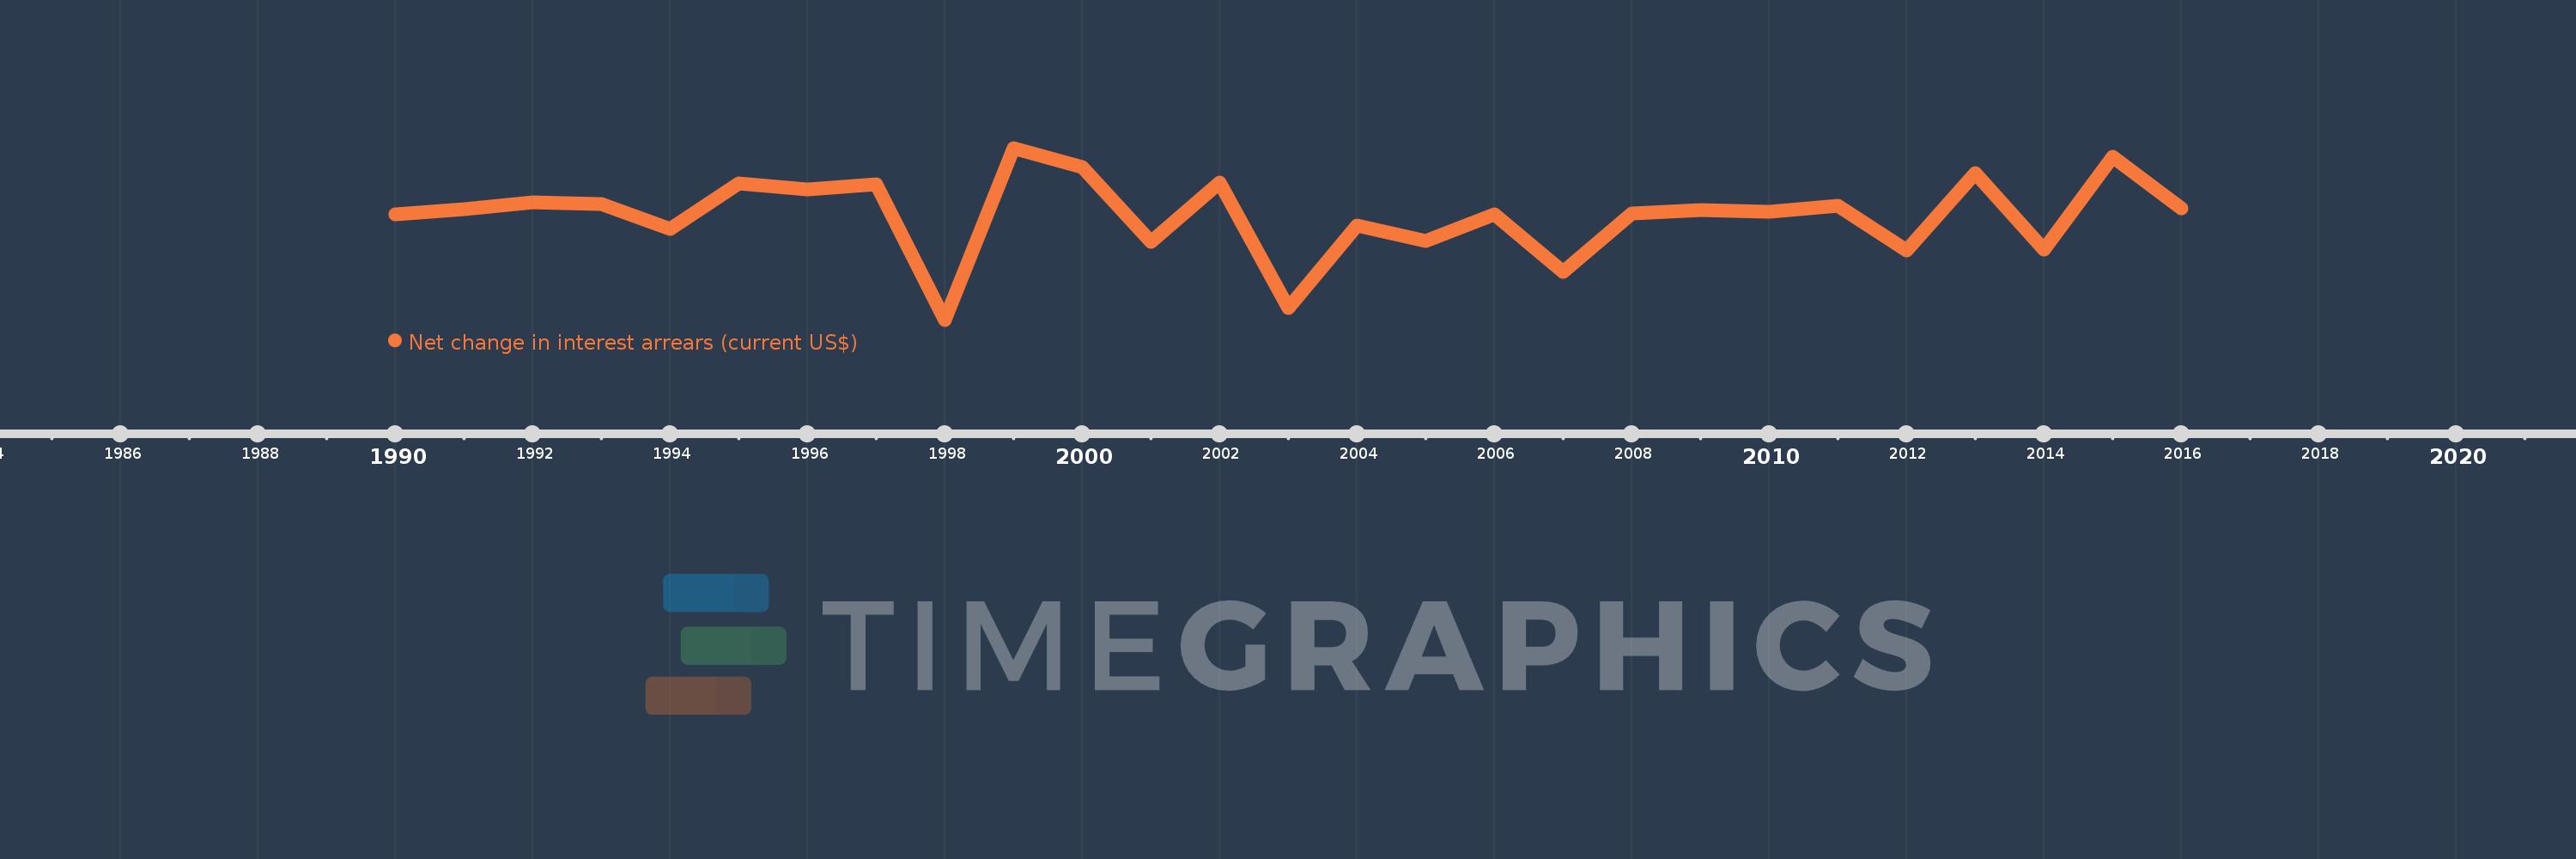
Net change in interest arrears (current US$)
2016,2015,2014,2013,2012,2011,2010,2009,2008,2007,2006,2005,2004,2003,2002,2001,2000,1999,1998,1997,1996,1995,1994,1993,1992,1991,1990
This statistics in other country:
Timeline:
This timeline shows a graph from 1990 to 2016 of Europe & Central Asia (excluding high income). No data until 1989. Number of actual observations by date: 27.
Source name:
World Development Indicators
Source organization:
World Bank, International Debt Statistics.
Categories, topics:
External Debt
Last updated:
apr 23, 2017
Indicators value changes by year
Minimum:
-4.689 bln
jan 1, 1998
Maximum:
2.954 bln
jan 1, 1999
At the date of observation
Value
Absolute change
Change from previous value
jan 1, 1991
225.921 mln
+225.921 mln
%
jan 1, 1992
543.47 mln
+317.549 mln
140.56%
jan 1, 1993
441.631 mln
-101.839 mln
-18.74%
jan 1, 1994
-654.88 mln
-1.097 bln
-248.29%
jan 1, 1995
1.372 bln
+2.027 bln
-309.58%
jan 1, 1996
1.11 bln
-262.644 mln
-19.14%
jan 1, 1997
1.325 bln
+214.9 mln
19.36%
jan 1, 1998
-4.689 bln
-6.014 bln
-453.96%
jan 1, 1999
2.954 bln
+7.643 bln
-162.99%
jan 1, 2000
2.12 bln
-834.068 mln
-28.24%
jan 1, 2001
-1.217 bln
-3.336 bln
-157.4%
jan 1, 2002
1.417 bln
+2.634 bln
-216.48%
jan 1, 2003
-4.167 bln
-5.584 bln
-394.02%
jan 1, 2004
-495.087 mln
+3.672 bln
-88.12%
jan 1, 2005
-1.17 bln
-674.649 mln
136.27%
jan 1, 2006
11.74 mln
+1.181 bln
-101.0%
jan 1, 2007
-2.56 bln
-2.572 bln
-21.91K%
jan 1, 2008
48.075 mln
+2.608 bln
-101.88%
jan 1, 2009
186.668 mln
+138.593 mln
288.28%
jan 1, 2010
117.972 mln
-68.696 mln
-36.8%
jan 1, 2011
384.93 mln
+266.958 mln
226.29%
jan 1, 2012
-1.603 bln
-1.988 bln
-516.52%
jan 1, 2013
1.818 bln
+3.421 bln
-213.37%
jan 1, 2014
-1.557 bln
-3.375 bln
-185.67%
jan 1, 2015
2.57 bln
+4.127 bln
-265.02%
jan 1, 2016
286.34 mln
-2.283 bln
-88.86%
Ranking of countries by current statistics by years


Comments: