29
/
en
AIzaSyAYiBZKx7MnpbEhh9jyipgxe19OcubqV5w
April 1, 2024
97852
Cabo Verde
CPV
true
2
1
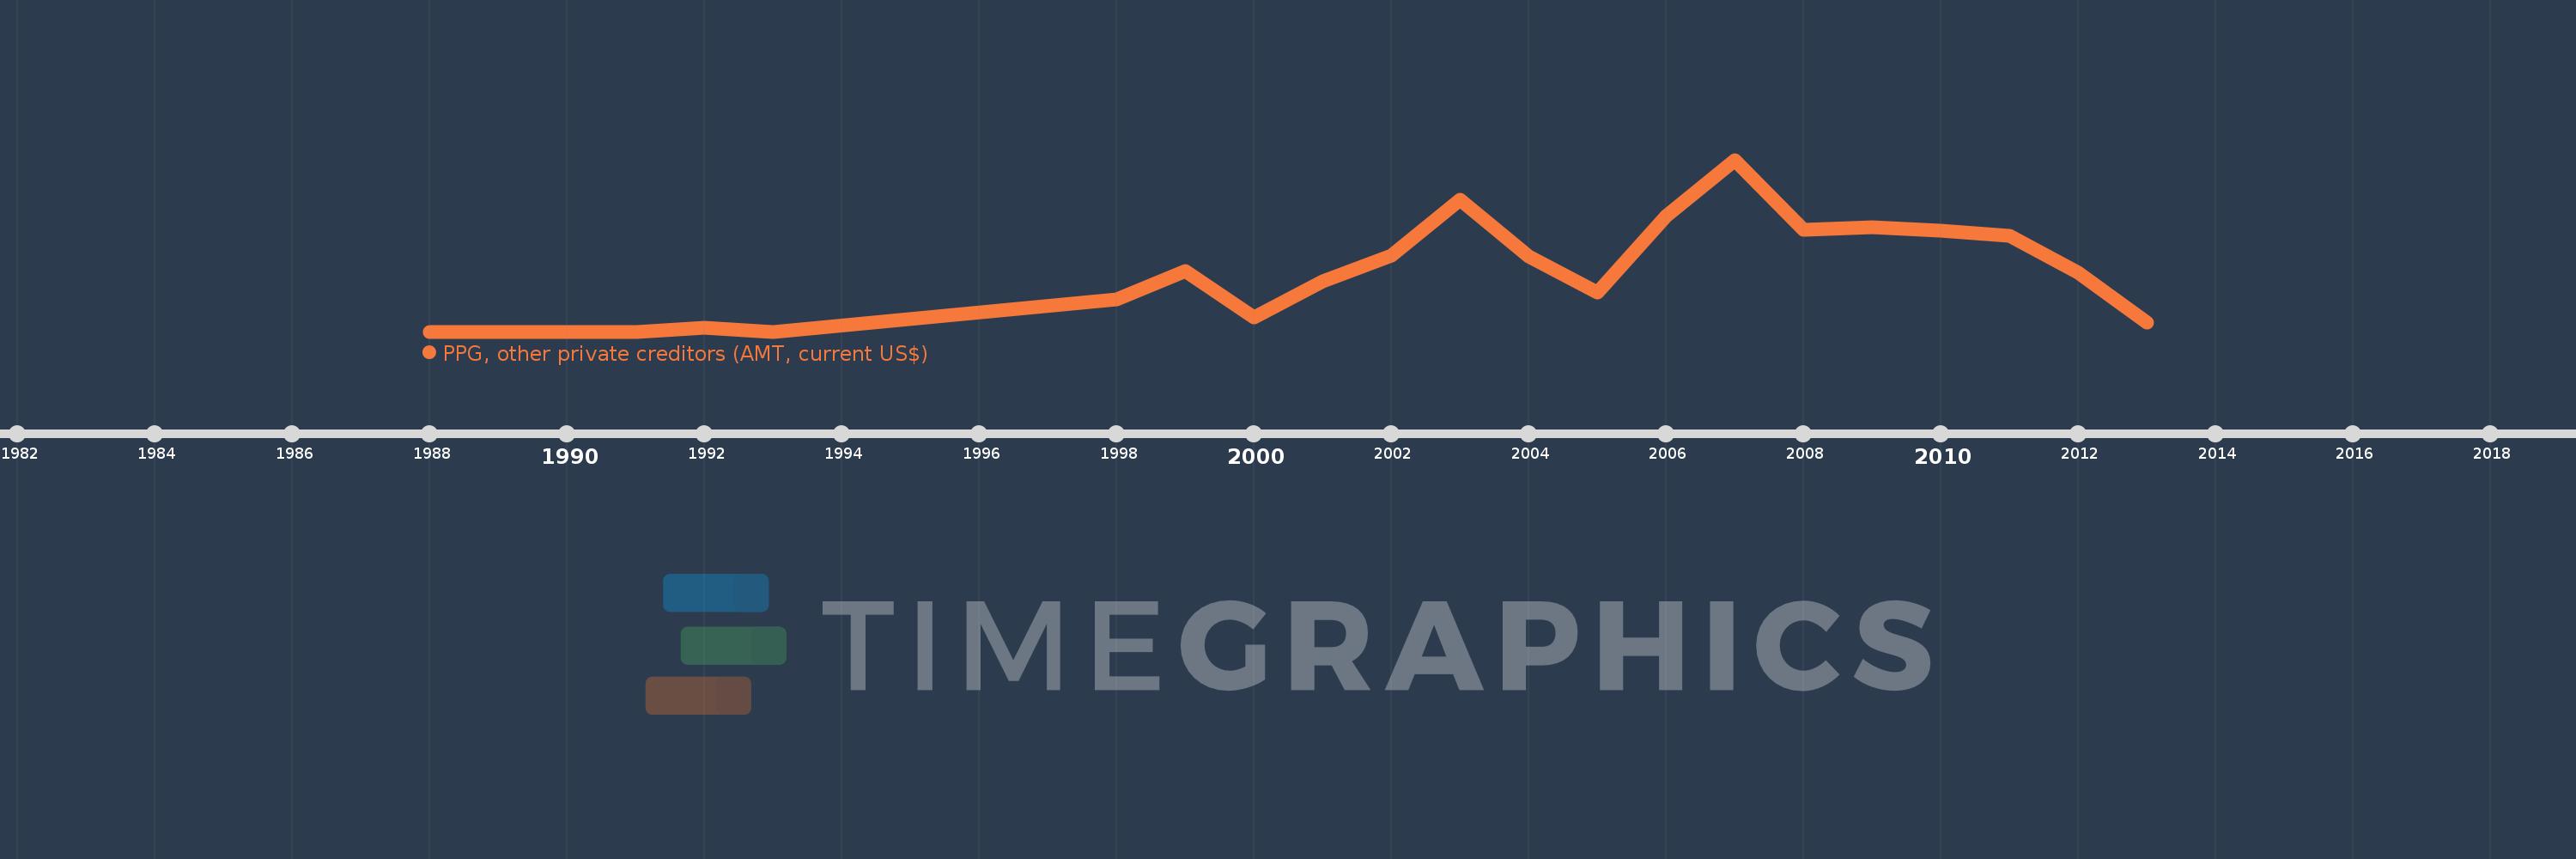
PPG, other private creditors (AMT, current US$)
2013,2012,2011,2010,2009,2008,2007,2006,2005,2004,2003,2002,2001,2000,1999,1998,1993,1992,1991,1990,1989,1988
This statistics in other country:
Timeline:
This timeline shows a graph from 1988 to 2013 of Cabo Verde. No data until 1987. Number of actual observations by date: 22.
Source name:
World Development Indicators
Source organization:
World Bank, International Debt Statistics.
Categories, topics:
External Debt
Last updated:
apr 23, 2017
Indicators value changes by year
Minimum:
120.0K
jan 1, 1988
Maximum:
5.904 mln
jan 1, 2007
At the date of observation
Value
Absolute change
Change from previous value
jan 1, 1988
120.0K
+120.0K
0.0%
jan 1, 1989
120.0K
0.0
0.0%
jan 1, 1990
120.0K
0.0
0.0%
jan 1, 1991
120.0K
0.0
0.0%
jan 1, 1992
240.0K
+120.0K
100.0%
jan 1, 1993
120.0K
-120.0K
-50.0%
jan 1, 1998
1.2 mln
+1.08 mln
900.0%
jan 1, 1999
2.16 mln
+960.0K
80.0%
jan 1, 2000
600.0K
-1.56 mln
-72.22%
jan 1, 2001
1.8 mln
+1.2 mln
200.0%
jan 1, 2002
2.684 mln
+884.0K
49.11%
jan 1, 2003
4.571 mln
+1.887 mln
70.31%
jan 1, 2004
2.64 mln
-1.931 mln
-42.24%
jan 1, 2005
1.445 mln
-1.195 mln
-45.27%
jan 1, 2006
4.006 mln
+2.561 mln
177.23%
jan 1, 2007
5.904 mln
+1.898 mln
47.38%
jan 1, 2008
3.557 mln
-2.347 mln
-39.75%
jan 1, 2009
3.624 mln
+67.0K
1.88%
jan 1, 2010
3.522 mln
-102.0K
-2.81%
jan 1, 2011
3.353 mln
-169.0K
-4.8%
jan 1, 2012
2.091 mln
-1.262 mln
-37.64%
jan 1, 2013
433.0K
-1.658 mln
-79.29%
Ranking of countries by current statistics by years


Comments: