29
/
en
AIzaSyAYiBZKx7MnpbEhh9jyipgxe19OcubqV5w
April 1, 2024
138615
Georgia
GEO
true
2
1
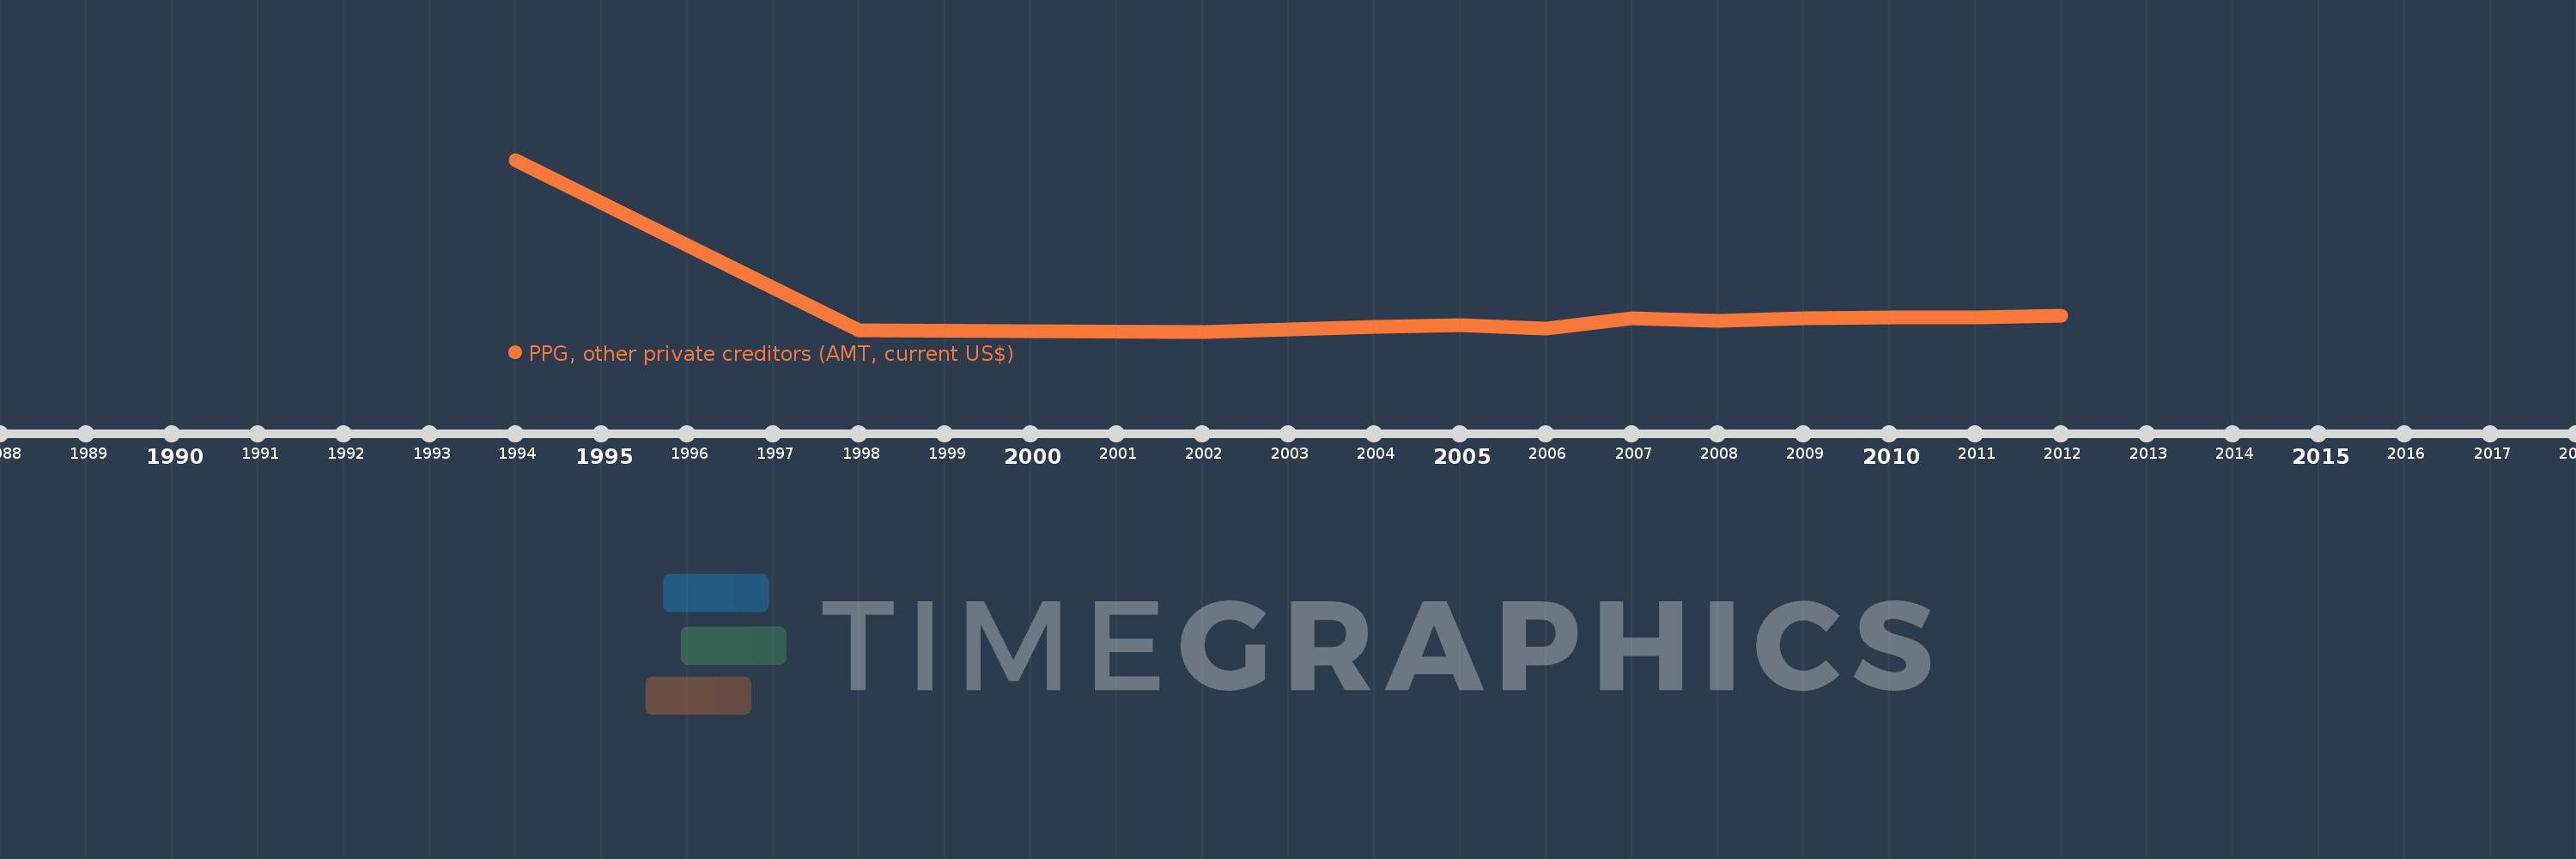
PPG, other private creditors (AMT, current US$)
2012,2011,2010,2009,2008,2007,2006,2005,2004,2003,2002,1998,1994
This statistics in other country:
Timeline:
This timeline shows a graph from 1994 to 2012 of Georgia. No data until 1993. Number of actual observations by date: 13.
Source name:
World Development Indicators
Source organization:
World Bank, International Debt Statistics.
Categories, topics:
External Debt
Last updated:
apr 23, 2017
Indicators value changes by year
Maximum:
4.729 mln
jan 1, 1994
At the date of observation
Value
Absolute change
Change from previous value
jan 1, 1994
4.729 mln
+4.729 mln
0.0%
jan 1, 1998
84.0K
-4.645 mln
-98.22%
jan 1, 2002
43.0K
-41.0K
-48.81%
jan 1, 2003
110.0K
+67.0K
155.81%
jan 1, 2004
162.0K
+52.0K
47.27%
jan 1, 2005
210.0K
+48.0K
29.63%
jan 1, 2006
118.0K
-92.0K
-43.81%
jan 1, 2007
406.0K
+288.0K
244.07%
jan 1, 2008
340.0K
-66.0K
-16.26%
jan 1, 2009
405.0K
+65.0K
19.12%
jan 1, 2010
419.0K
+14.0K
3.46%
jan 1, 2011
434.0K
+15.0K
3.58%
jan 1, 2012
488.0K
+54.0K
12.44%
Ranking of countries by current statistics by years


Comments: