29
/
en
AIzaSyAYiBZKx7MnpbEhh9jyipgxe19OcubqV5w
April 1, 2024
246162
South Africa
ZAF
true
2
1
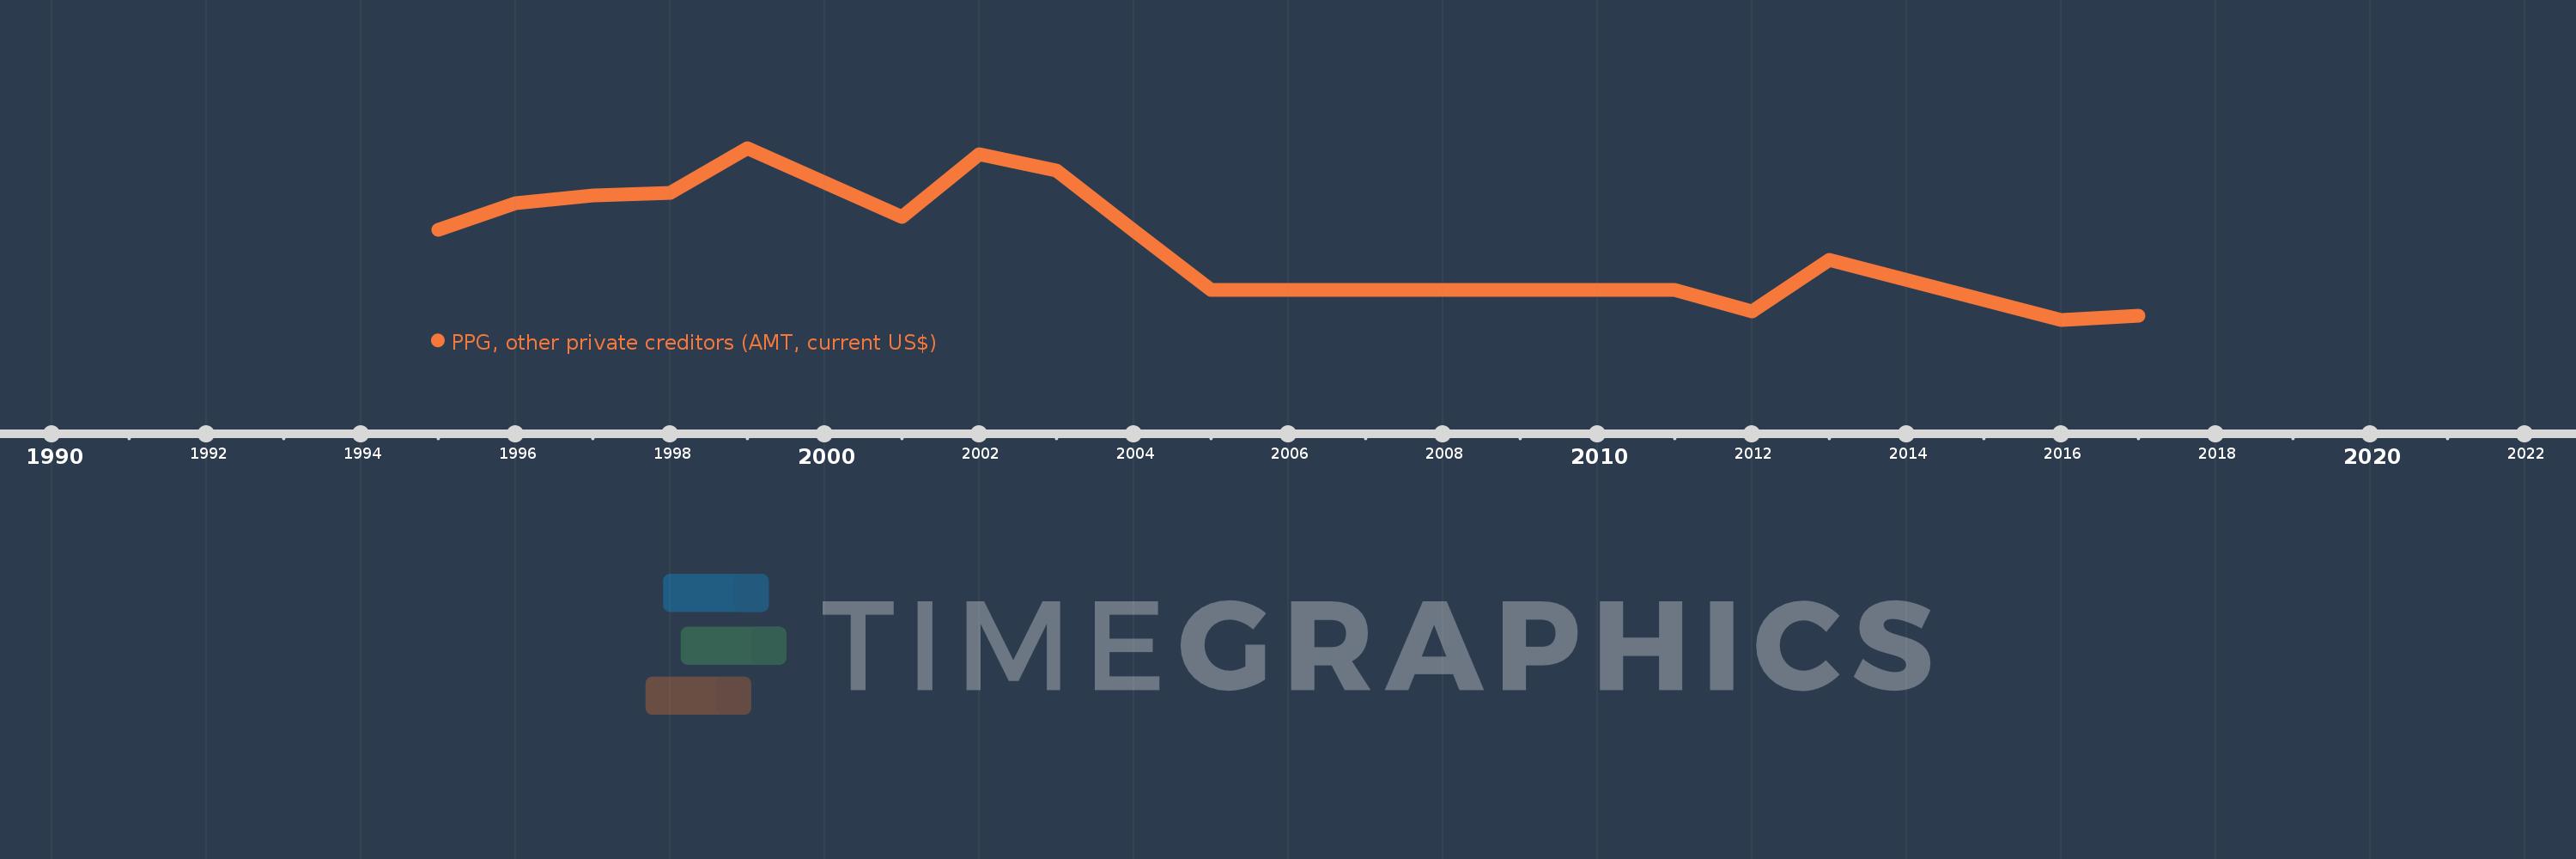
PPG, other private creditors (AMT, current US$)
2017,2016,2013,2012,2011,2010,2009,2008,2007,2006,2005,2004,2003,2002,2001,1999,1998,1997,1996,1995
This statistics in other country:
Timeline:
This timeline shows a graph from 1995 to 2017 of South Africa. No data until 1994. Number of actual observations by date: 20.
Source name:
World Development Indicators
Source organization:
World Bank, International Debt Statistics.
Categories, topics:
External Debt
Last updated:
apr 23, 2017
Indicators value changes by year
Minimum:
43.939 mln
jan 1, 2016
Maximum:
628.21 mln
jan 1, 1999
At the date of observation
Value
Absolute change
Change from previous value
jan 1, 1995
351.217 mln
+351.217 mln
0.0%
jan 1, 1996
439.199 mln
+87.982 mln
25.05%
jan 1, 1997
467.271 mln
+28.072 mln
6.39%
jan 1, 1998
474.928 mln
+7.657 mln
1.64%
jan 1, 1999
628.21 mln
+153.282 mln
32.27%
jan 1, 2001
393.422 mln
-234.788 mln
-37.37%
jan 1, 2002
607.218 mln
+213.796 mln
54.34%
jan 1, 2003
550.552 mln
-56.666 mln
-9.33%
jan 1, 2004
347.882 mln
-202.67 mln
-36.81%
jan 1, 2005
145.218 mln
-202.664 mln
-58.26%
jan 1, 2006
145.216 mln
-2.0K
0.0%
jan 1, 2007
145.218 mln
+2.0K
0.0%
jan 1, 2008
145.216 mln
-2.0K
0.0%
jan 1, 2009
145.218 mln
+2.0K
0.0%
jan 1, 2010
145.216 mln
-2.0K
0.0%
jan 1, 2011
145.218 mln
+2.0K
0.0%
jan 1, 2012
72.609 mln
-72.609 mln
-50.0%
jan 1, 2013
249.0 mln
+176.391 mln
242.93%
jan 1, 2016
43.939 mln
-205.061 mln
-82.35%
jan 1, 2017
58.518 mln
+14.579 mln
33.18%
Ranking of countries by current statistics by years


Comments: