29
/
en
AIzaSyAYiBZKx7MnpbEhh9jyipgxe19OcubqV5w
April 1, 2024
97815
Cabo Verde
CPV
true
2
1
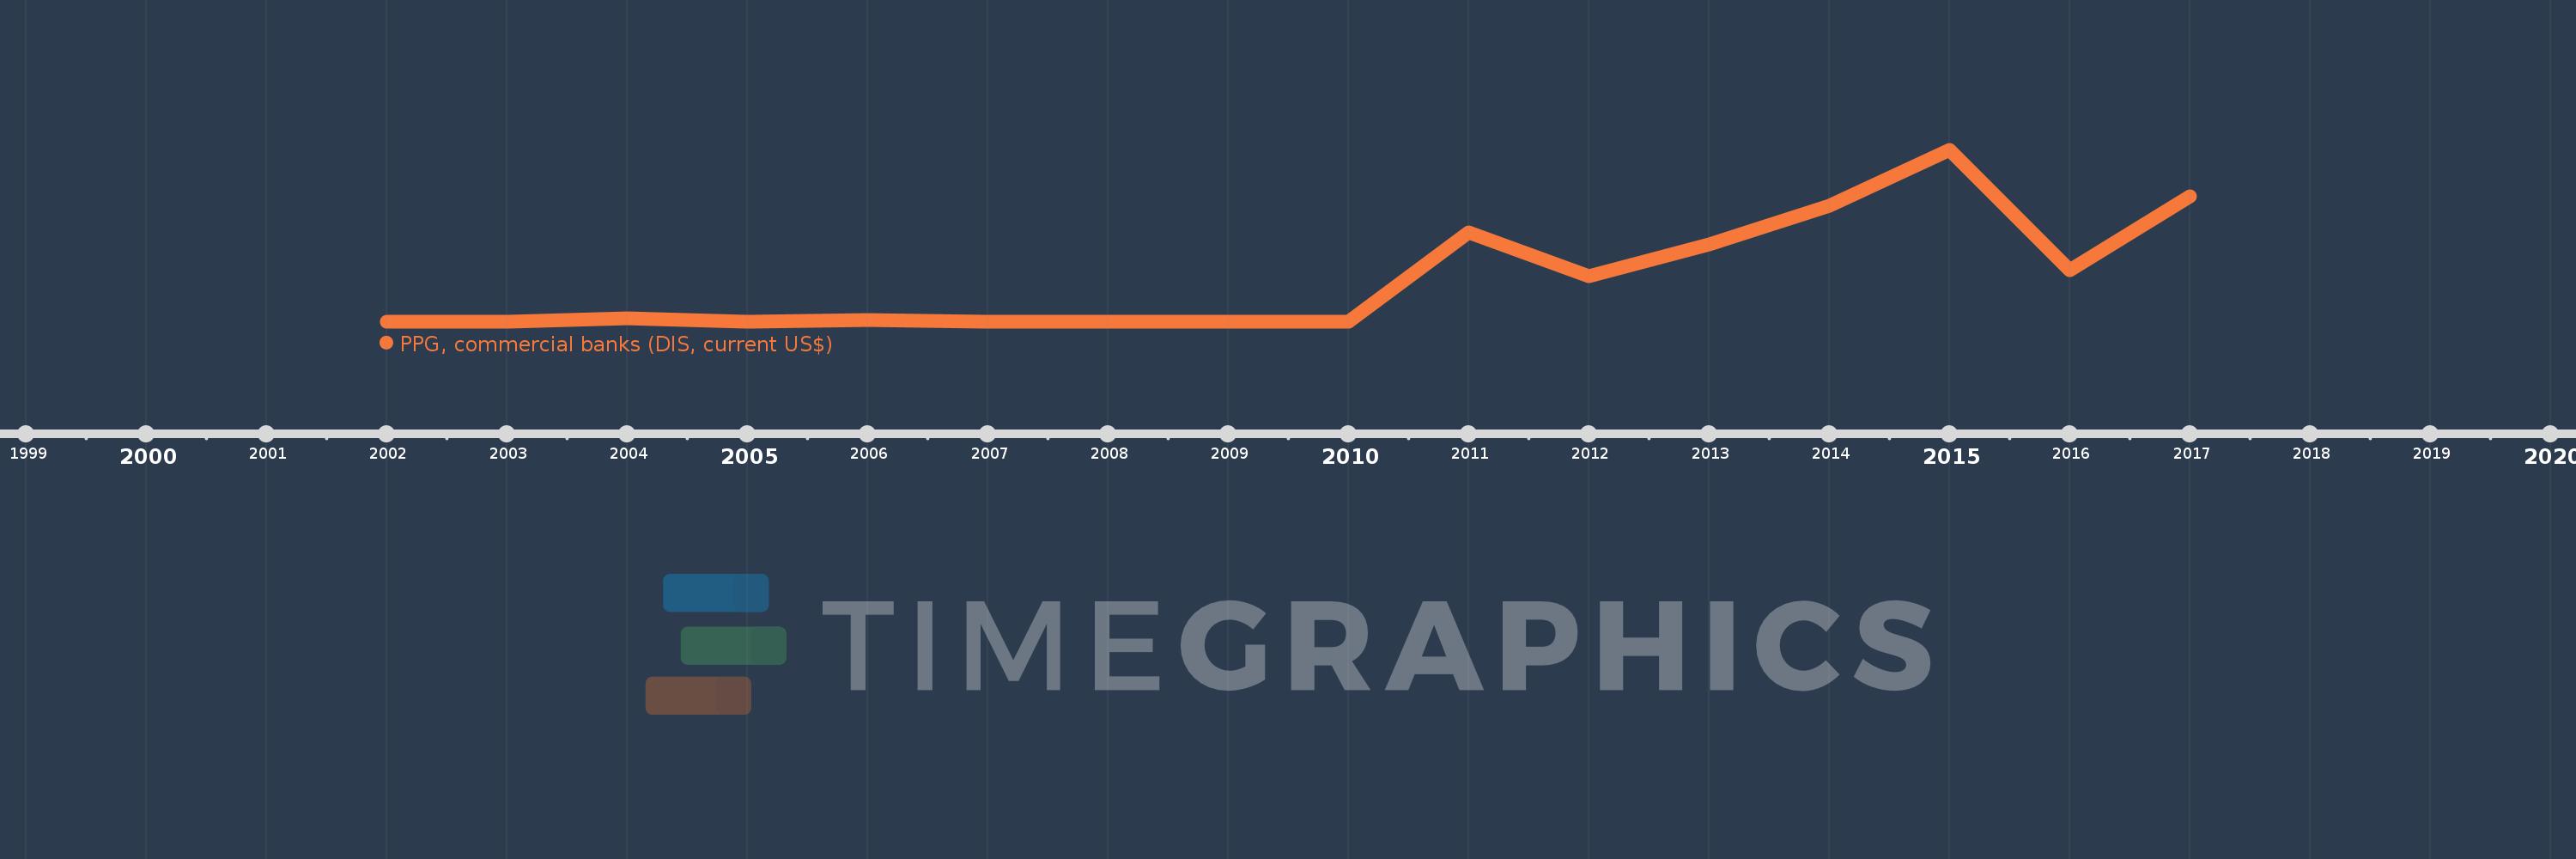
PPG, commercial banks (DIS, current US$)
2017,2016,2015,2014,2013,2012,2011,2010,2007,2006,2005,2004,2003,2002
This statistics in other country:
Timeline:
This timeline shows a graph from 2002 to 2017 of Cabo Verde. No data until 2001. Number of actual observations by date: 14.
Source name:
World Development Indicators
Source organization:
World Bank, International Debt Statistics.
Categories, topics:
External Debt
Last updated:
apr 23, 2017
Indicators value changes by year
Maximum:
95.515 mln
jan 1, 2015
At the date of observation
Value
Absolute change
Change from previous value
jan 1, 2002
170.0K
+170.0K
0.0%
jan 1, 2003
71.0K
-99.0K
-58.24%
jan 1, 2004
1.846 mln
+1.775 mln
2.5K%
jan 1, 2005
124.0K
-1.722 mln
-93.28%
jan 1, 2006
943.0K
+819.0K
660.48%
jan 1, 2007
95.0K
-848.0K
-89.93%
jan 1, 2010
0.0
-95.0K
-100.0%
jan 1, 2011
49.657 mln
+49.657 mln
%
jan 1, 2012
25.426 mln
-24.231 mln
-48.8%
jan 1, 2013
43.009 mln
+17.583 mln
69.15%
jan 1, 2014
64.413 mln
+21.404 mln
49.77%
jan 1, 2015
95.515 mln
+31.102 mln
48.29%
jan 1, 2016
28.567 mln
-66.948 mln
-70.09%
jan 1, 2017
69.644 mln
+41.077 mln
143.79%
Ranking of countries by current statistics by years


Comments: