29
/
en
AIzaSyAYiBZKx7MnpbEhh9jyipgxe19OcubqV5w
April 1, 2024
272789
Uganda
UGA
true
2
1
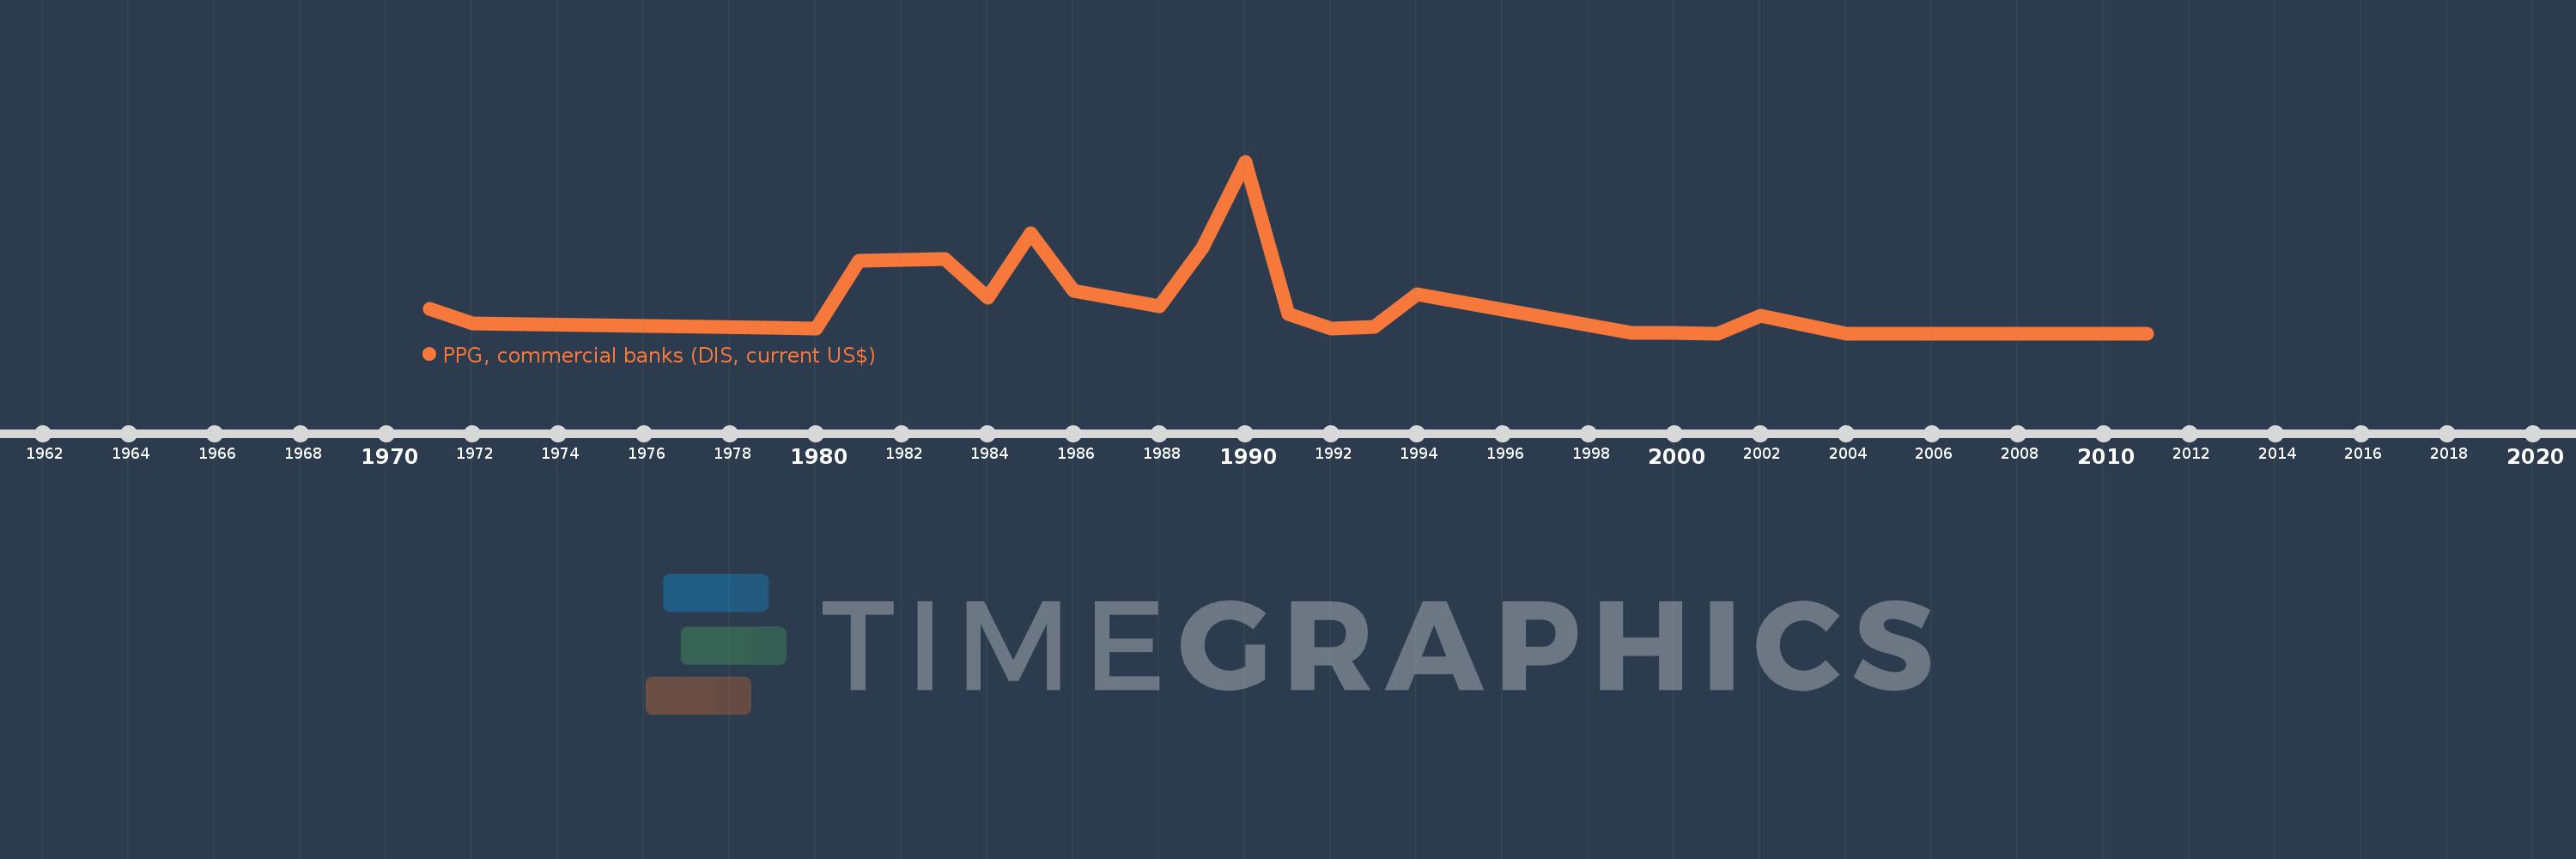
PPG, commercial banks (DIS, current US$)
2011,2010,2009,2008,2007,2006,2005,2004,2002,2001,2000,1999,1994,1993,1992,1991,1990,1989,1988,1986,1985,1984,1983,1981,1980,1979,1972,1971
This statistics in other country:
Timeline:
This timeline shows a graph from 1971 to 2011 of Uganda. No data until 1970. Number of actual observations by date: 28.
Source name:
World Development Indicators
Source organization:
World Bank, International Debt Statistics.
Categories, topics:
External Debt
Last updated:
apr 23, 2017
Indicators value changes by year
Maximum:
39.142 mln
jan 1, 1990
At the date of observation
Value
Absolute change
Change from previous value
jan 1, 1971
5.619 mln
+5.619 mln
0.0%
jan 1, 1972
2.176 mln
-3.443 mln
-61.27%
jan 1, 1979
1.368 mln
-808.0K
-37.13%
jan 1, 1980
1.037 mln
-331.0K
-24.2%
jan 1, 1981
16.503 mln
+15.466 mln
1.49K%
jan 1, 1983
16.897 mln
+394.0K
2.39%
jan 1, 1984
8.033 mln
-8.864 mln
-52.46%
jan 1, 1985
22.797 mln
+14.764 mln
183.79%
jan 1, 1986
9.592 mln
-13.205 mln
-57.92%
jan 1, 1988
6.248 mln
-3.344 mln
-34.86%
jan 1, 1989
19.39 mln
+13.142 mln
210.34%
jan 1, 1990
39.142 mln
+19.752 mln
101.87%
jan 1, 1991
4.453 mln
-34.689 mln
-88.62%
jan 1, 1992
1.066 mln
-3.387 mln
-76.06%
jan 1, 1993
1.452 mln
+386.0K
36.21%
jan 1, 1994
9.0 mln
+7.548 mln
519.83%
jan 1, 1999
36.0K
-8.964 mln
-99.6%
jan 1, 2000
160.0K
+124.0K
344.44%
jan 1, 2001
0.0
-160.0K
-100.0%
jan 1, 2002
3.971 mln
+3.971 mln
%
jan 1, 2004
0.0
-3.971 mln
-100.0%
Ranking of countries by current statistics by years


Comments: