Download This statistics in other country:
Timeline:
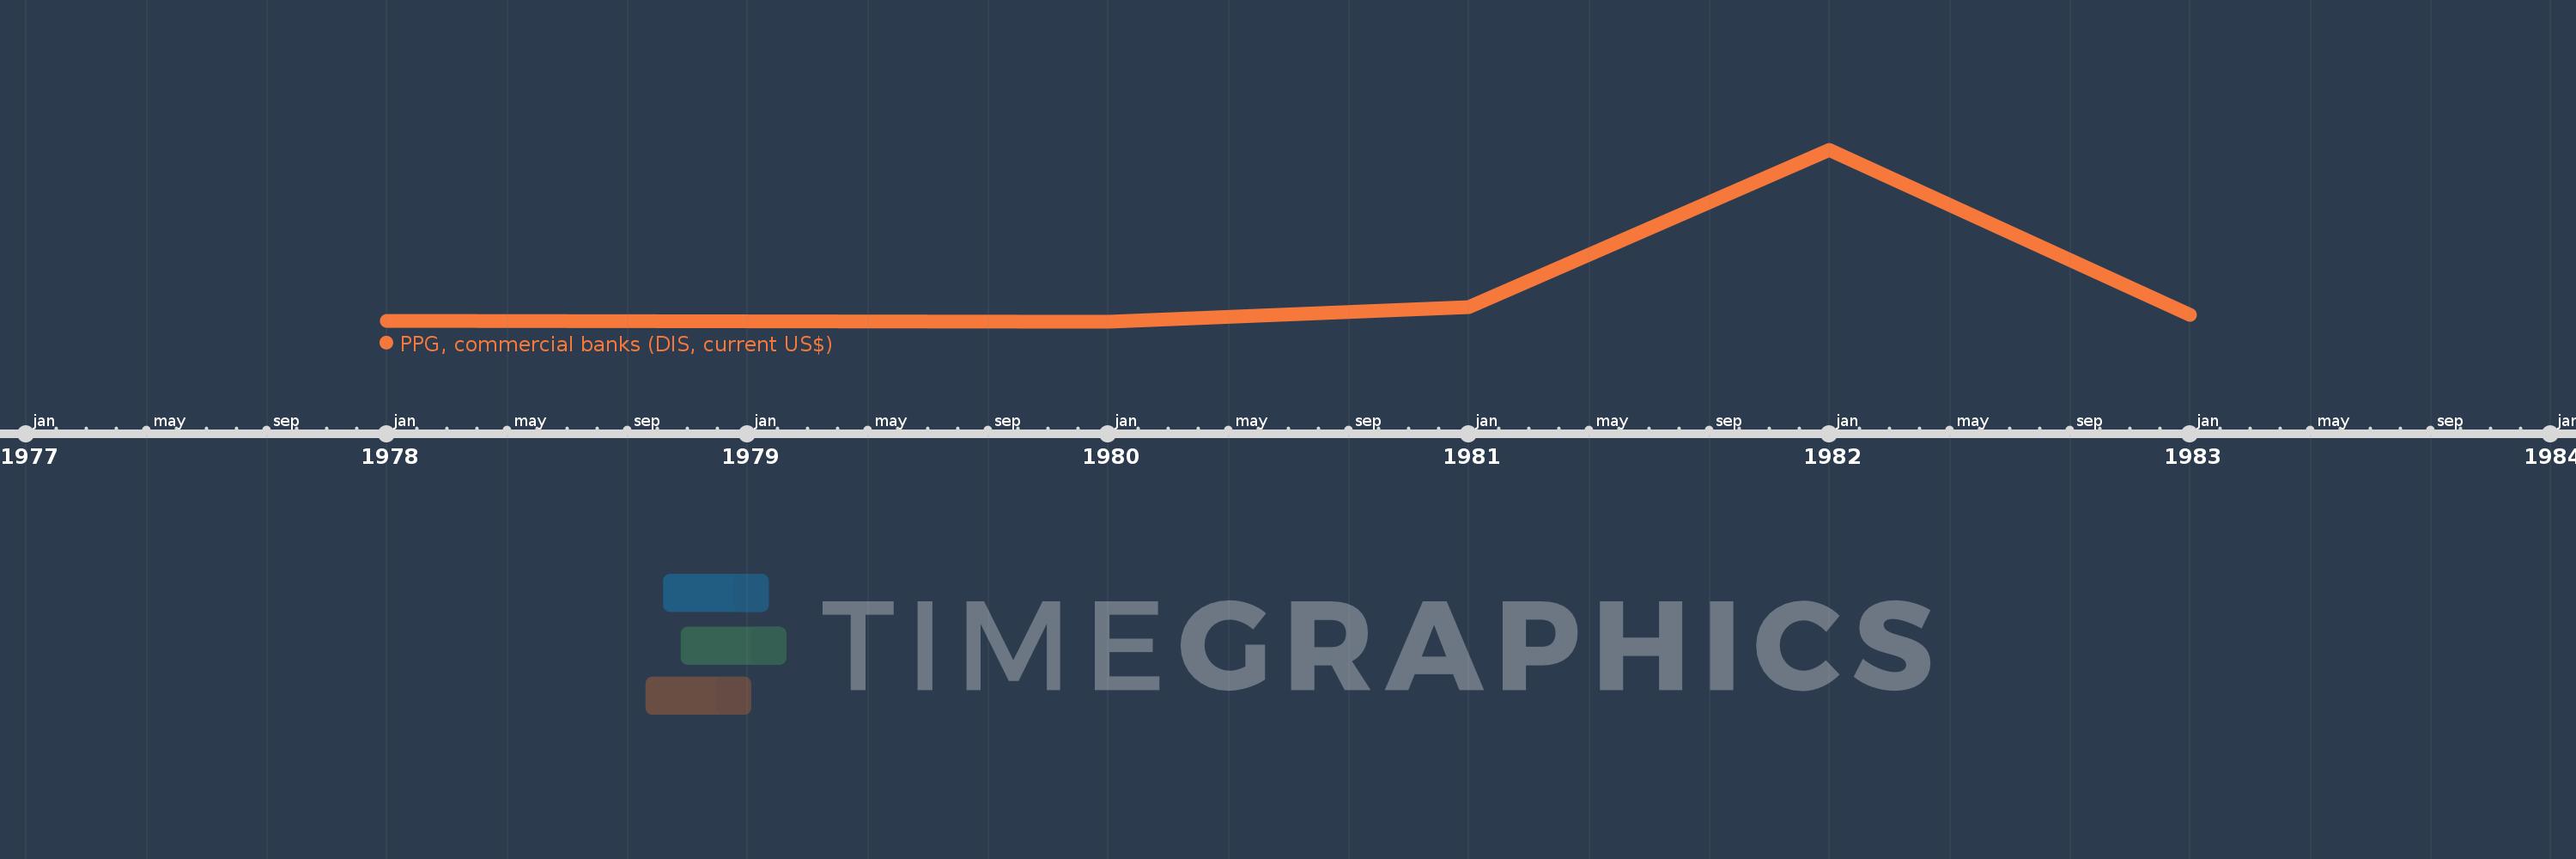
This timeline shows a graph from 1978 to 1983 of Haiti. No data until 1977. Number of actual observations by date: 5.
Source name:
World Development Indicators
Source organization:
World Bank, International Debt Statistics.
Categories, topics:
External Debt
Last updated:
apr 23, 2017
Indicators value changes by year
Minimum:
1.8 mln
jan 1, 1980
Maximum:
41.772 mln
jan 1, 1982
At the date of observation
Value
Absolute change
Change from the previous value
jan 1, 1978
2.0 mln
+2.0 mln
0.0%
jan 1, 1980
1.8 mln
-200.0K
-10.0%
jan 1, 1981
5.19 mln
+3.39 mln
188.33%
jan 1, 1982
41.772 mln
+36.582 mln
704.86%
jan 1, 1983
3.5 mln
-38.272 mln
-91.62%
Ranking of countries by current statistics by years
