29
/
en
AIzaSyAYiBZKx7MnpbEhh9jyipgxe19OcubqV5w
April 1, 2024
92690
Brunei Darussalam
BRN
true
2
1
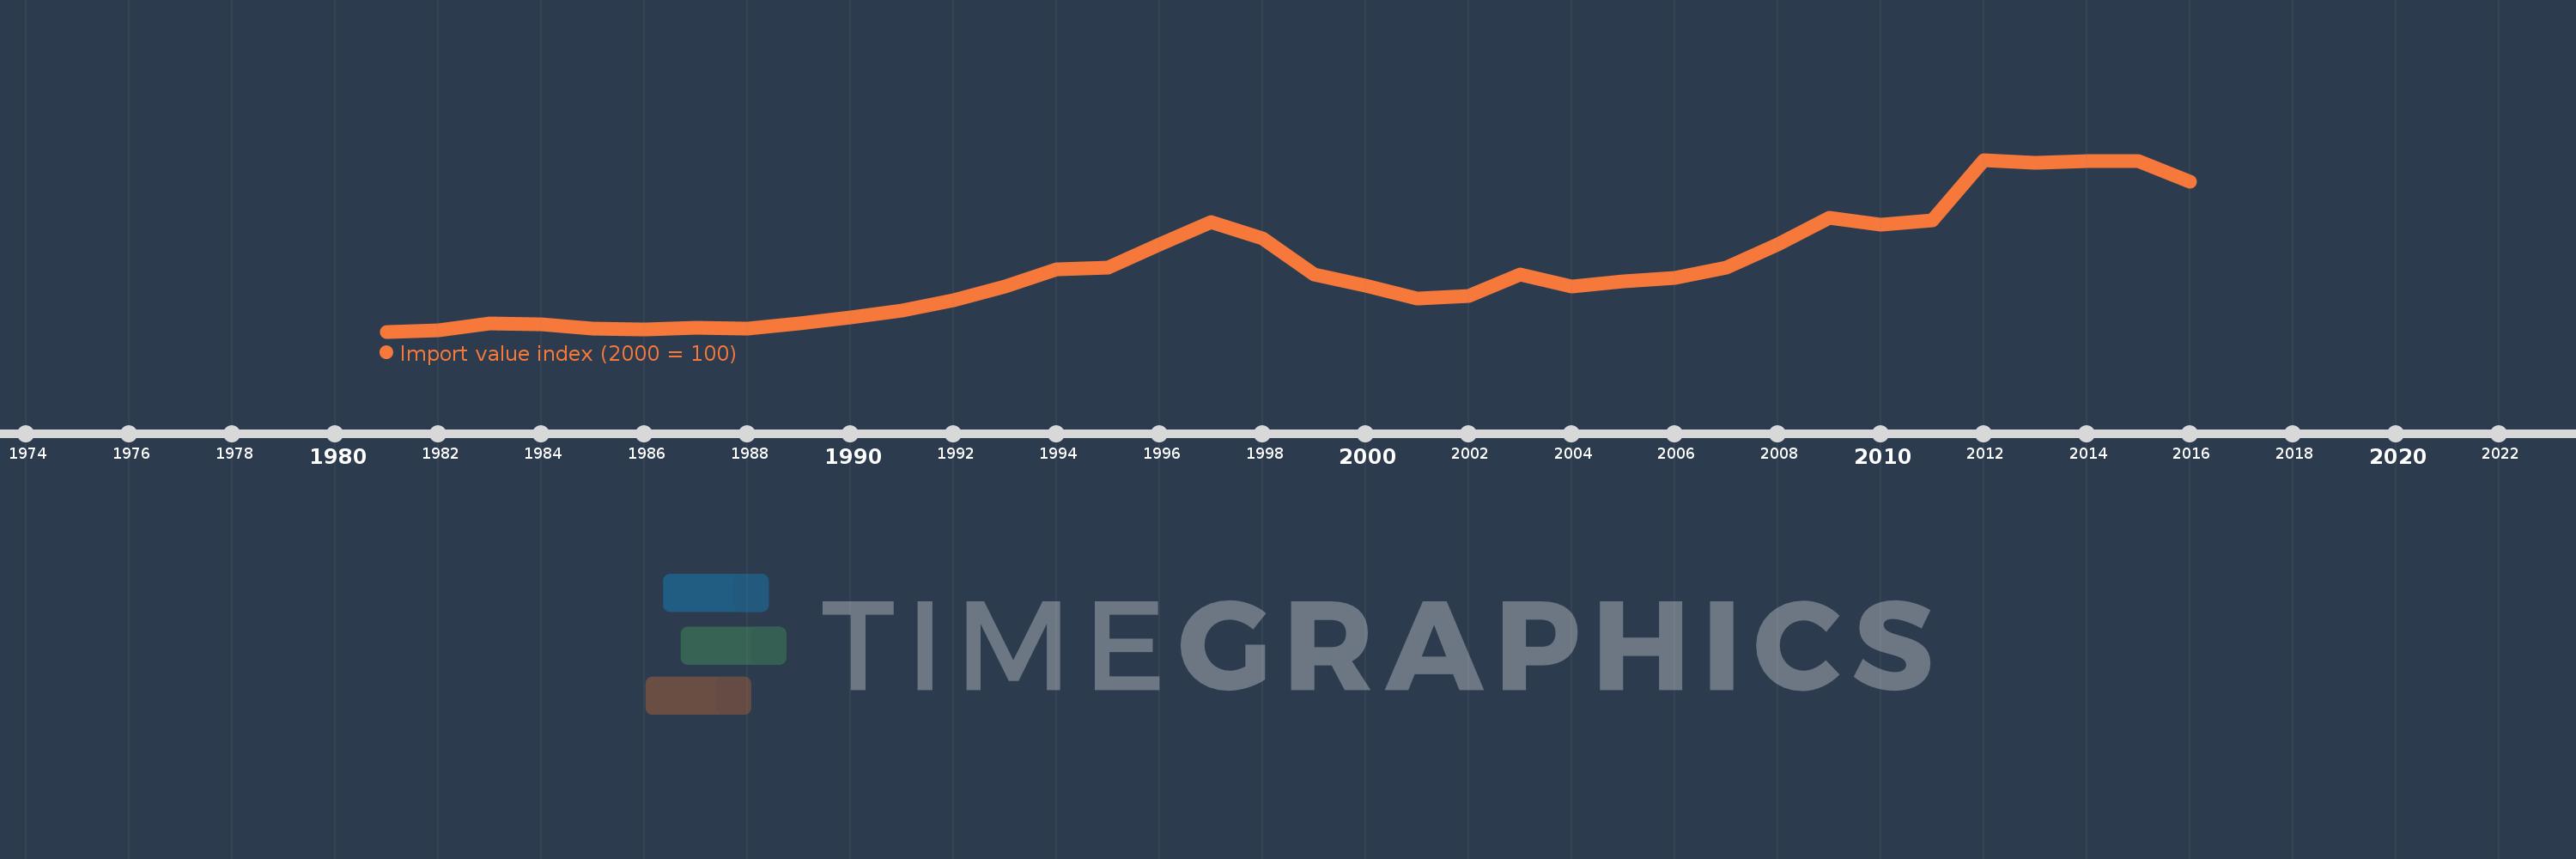
Import value index (2000 = 100)
2016,2015,2014,2013,2012,2011,2010,2009,2008,2007,2006,2005,2004,2003,2002,2001,2000,1999,1998,1997,1996,1995,1994,1993,1992,1991,1990,1989,1988,1987,1986,1985,1984,1983,1982,1981
This statistics in other country:
AfghanistanAlbaniaAlgeriaAmerican SamoaAndorraAngolaAntigua and BarbudaArgentinaArmeniaArubaAustraliaAustriaAzerbaijanBahamas, TheBahrainBangladeshBarbadosBelarusBelgiumBelizeBeninBermudaBhutanBoliviaBosnia and HerzegovinaBotswanaBrazilBritish Virgin IslandsBrunei DarussalamBulgariaBurkina FasoBurundiCabo VerdeCambodiaCameroonCanadaCayman IslandsCentral African RepublicChadChileChinaColombiaComorosCongo, Dem. Rep.Congo, Rep.Costa RicaCote d'IvoireCroatiaCubaCuracaoCyprusCzech RepublicDenmarkDjiboutiDominicaDominican RepublicEcuadorEgypt, Arab Rep.El SalvadorEquatorial GuineaEritreaEstoniaEthiopiaFaroe IslandsFijiFinlandFranceFrench PolynesiaGabonGambia, TheGeorgiaGermanyGhanaGibraltarGreeceGreenlandGrenadaGuamGuatemalaGuineaGuinea-BissauGuyanaHaitiHondurasHong Kong SAR, ChinaHungaryIcelandIndiaIndonesiaIran, Islamic Rep.IraqIrelandIsraelItalyJamaicaJapanJordanKazakhstanKenyaKiribatiKorea, Dem. People’s Rep.Korea, Rep.KuwaitKyrgyz RepublicLao PDRLatviaLebanonLesothoLiberiaLibyaLithuaniaLuxembourgMacao SAR, ChinaMacedonia, FYRMadagascarMalawiMalaysiaMaldivesMaliMaltaMarshall IslandsMauritaniaMauritiusMexicoMicronesia, Fed. Sts.MoldovaMongoliaMoroccoMozambiqueMyanmarNamibiaNauruNepalNetherlandsNew CaledoniaNew ZealandNicaraguaNigerNigeriaNorthern Mariana IslandsNorwayOmanPakistanPalauPanamaPapua New GuineaParaguayPeruPhilippinesPolandPortugalQatarRomaniaRussian FederationRwandaSamoaSao Tome and PrincipeSaudi ArabiaSenegalSerbiaSeychellesSierra LeoneSingaporeSlovak RepublicSloveniaSolomon IslandsSomaliaSouth AfricaSpainSri LankaSt. Kitts and NevisSt. LuciaSt. Vincent and the GrenadinesSudanSurinameSwazilandSwedenSwitzerlandSyrian Arab RepublicTajikistanTanzaniaThailandTogoTongaTrinidad and TobagoTunisiaTurkeyTurkmenistanTurks and Caicos IslandsUgandaUkraineUnited Arab EmiratesUnited KingdomUnited StatesUruguayUzbekistanVanuatuVenezuela, RBVietnamWest Bank and GazaYemen, Rep.ZambiaZimbabwe Timeline:
This timeline shows a graph from 1981 to 2016 of Brunei Darussalam. No data until 1980. Number of actual observations by date: 36.
Source name:
World Development Indicators
Source organization:
United Nations Conference on Trade and Development, Handbook of Statistics and data files, and International Monetary Fund, International Financial Statistics.
Categories, topics:
Private Sector, Trade
Last updated:
apr 23, 2017
Indicators value changes by year
Maximum:
327.797
jan 1, 2012
At the date of observation
Value
Absolute change
Change from previous value
jan 1, 1981
46.52
+46.52
0.0%
jan 1, 1982
48.309
+1.789
3.84%
jan 1, 1983
59.431
+11.122
23.02%
jan 1, 1984
58.862
-0.569
-0.96%
jan 1, 1985
50.894
-7.967
-13.54%
jan 1, 1986
50.0
-0.894
-1.76%
jan 1, 1987
53.333
+3.333
6.67%
jan 1, 1988
52.114
-1.22
-2.29%
jan 1, 1989
60.488
+8.374
16.07%
jan 1, 1990
69.837
+9.35
15.46%
jan 1, 1991
81.382
+11.545
16.53%
jan 1, 1992
98.211
+16.829
20.68%
jan 1, 1993
120.488
+22.276
22.68%
jan 1, 1994
148.13
+27.642
22.94%
jan 1, 1995
150.732
+2.602
1.76%
jan 1, 1996
188.889
+38.157
25.31%
jan 1, 1997
225.294
+36.405
19.27%
jan 1, 1998
199.006
-26.287
-11.67%
jan 1, 1999
140.199
-58.808
-29.55%
jan 1, 2000
121.229
-18.97
-13.53%
jan 1, 2001
100.0
-21.229
-17.51%
jan 1, 2002
104.697
+4.697
4.7%
jan 1, 2003
140.56
+35.863
34.25%
jan 1, 2004
119.874
-20.687
-14.72%
jan 1, 2005
128.455
+8.582
7.16%
jan 1, 2006
134.688
+6.233
4.85%
jan 1, 2007
151.417
+16.729
12.42%
jan 1, 2008
189.767
+38.35
25.33%
jan 1, 2009
232.327
+42.56
22.43%
jan 1, 2010
221.221
-11.106
-4.78%
jan 1, 2011
229.249
+8.028
3.63%
jan 1, 2012
327.797
+98.548
42.99%
jan 1, 2013
322.694
-5.103
-1.56%
jan 1, 2014
326.327
+3.632
1.13%
jan 1, 2015
325.089
-1.237
-0.38%
jan 1, 2016
291.696
-33.393
-10.27%
Ranking of countries by current statistics by years


Comments: