29
/
en
AIzaSyAYiBZKx7MnpbEhh9jyipgxe19OcubqV5w
April 1, 2024
251995
St. Vincent and the Grenadines
VCT
true
2
1
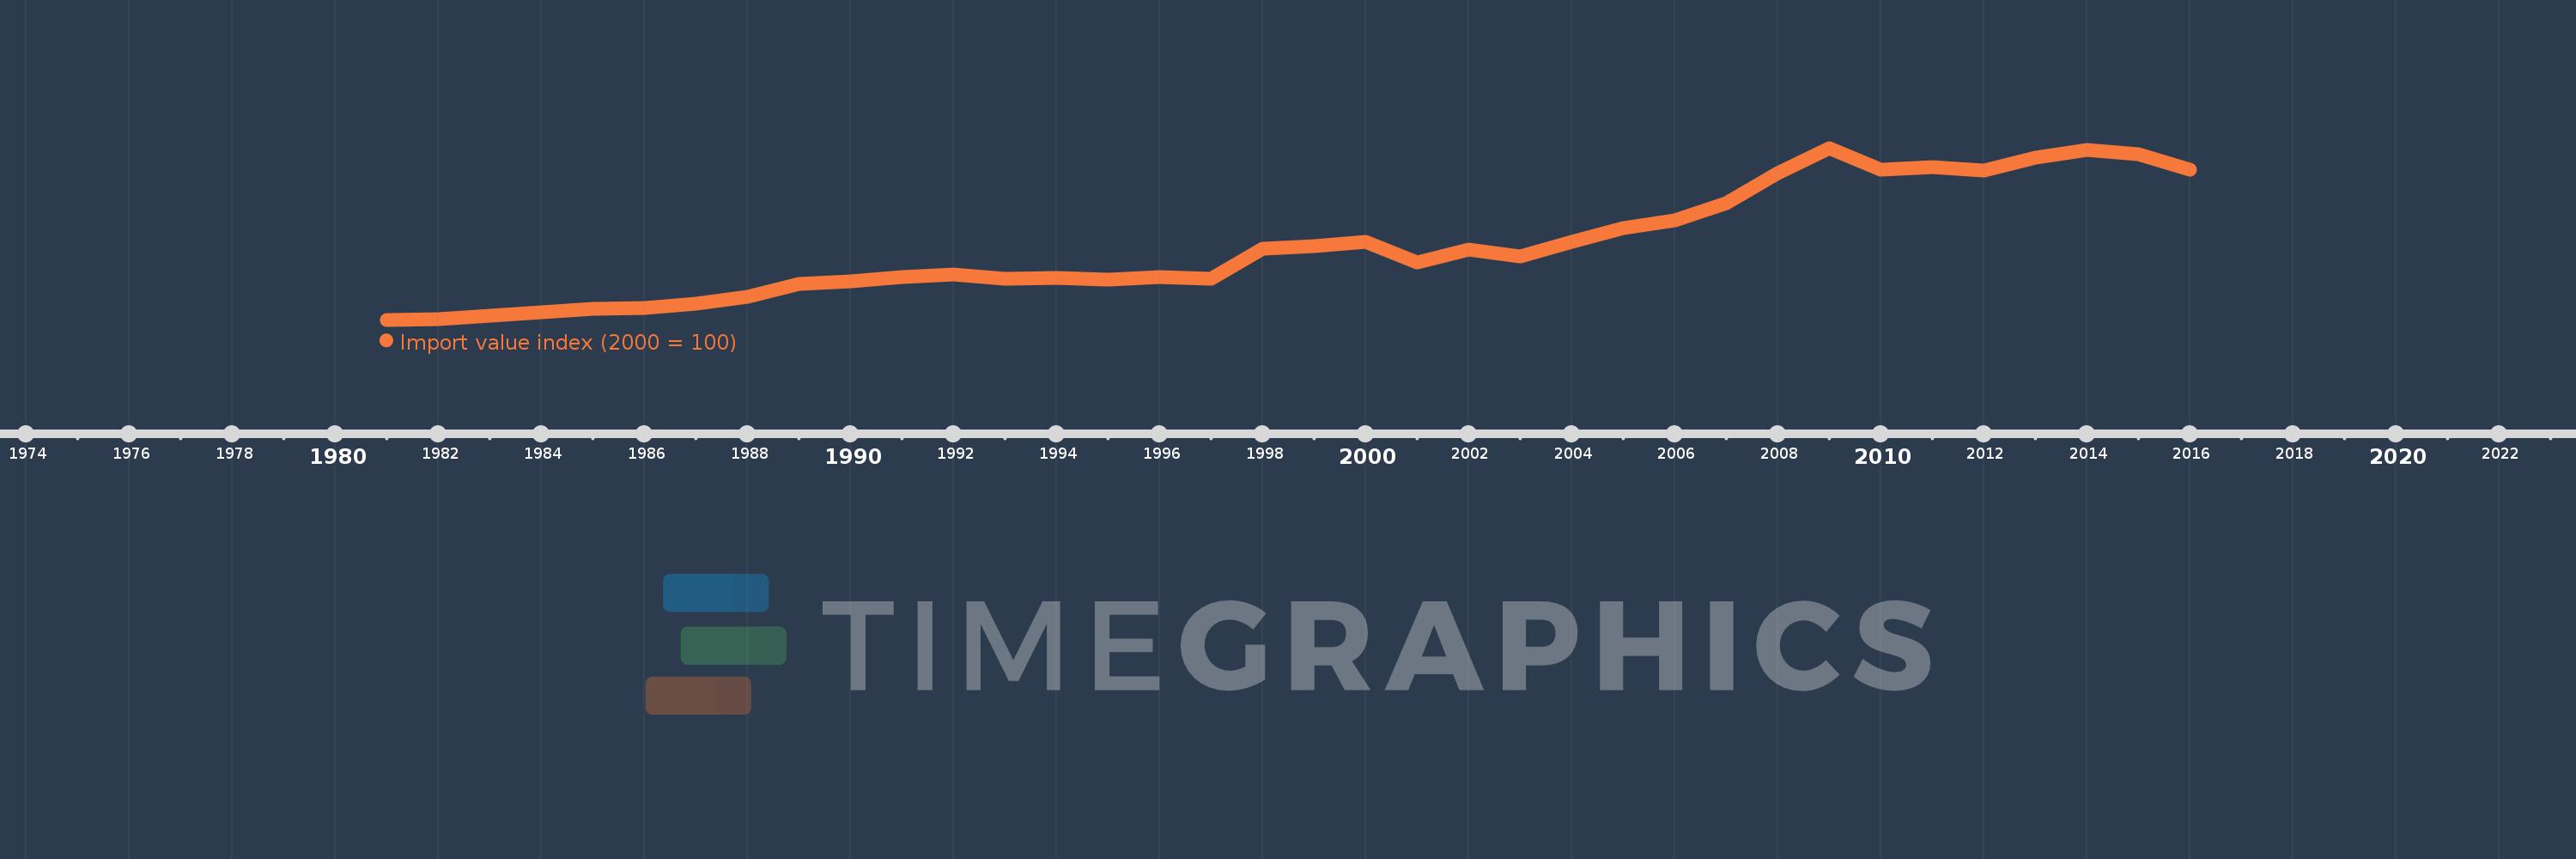
Import value index (2000 = 100)
2016,2015,2014,2013,2012,2011,2010,2009,2008,2007,2006,2005,2004,2003,2002,2001,2000,1999,1998,1997,1996,1995,1994,1993,1992,1991,1990,1989,1988,1987,1986,1985,1984,1983,1982,1981
This statistics in other country:
AfghanistanAlbaniaAlgeriaAmerican SamoaAndorraAngolaAntigua and BarbudaArgentinaArmeniaArubaAustraliaAustriaAzerbaijanBahamas, TheBahrainBangladeshBarbadosBelarusBelgiumBelizeBeninBermudaBhutanBoliviaBosnia and HerzegovinaBotswanaBrazilBritish Virgin IslandsBrunei DarussalamBulgariaBurkina FasoBurundiCabo VerdeCambodiaCameroonCanadaCayman IslandsCentral African RepublicChadChileChinaColombiaComorosCongo, Dem. Rep.Congo, Rep.Costa RicaCote d'IvoireCroatiaCubaCuracaoCyprusCzech RepublicDenmarkDjiboutiDominicaDominican RepublicEcuadorEgypt, Arab Rep.El SalvadorEquatorial GuineaEritreaEstoniaEthiopiaFaroe IslandsFijiFinlandFranceFrench PolynesiaGabonGambia, TheGeorgiaGermanyGhanaGibraltarGreeceGreenlandGrenadaGuamGuatemalaGuineaGuinea-BissauGuyanaHaitiHondurasHong Kong SAR, ChinaHungaryIcelandIndiaIndonesiaIran, Islamic Rep.IraqIrelandIsraelItalyJamaicaJapanJordanKazakhstanKenyaKiribatiKorea, Dem. People’s Rep.Korea, Rep.KuwaitKyrgyz RepublicLao PDRLatviaLebanonLesothoLiberiaLibyaLithuaniaLuxembourgMacao SAR, ChinaMacedonia, FYRMadagascarMalawiMalaysiaMaldivesMaliMaltaMarshall IslandsMauritaniaMauritiusMexicoMicronesia, Fed. Sts.MoldovaMongoliaMoroccoMozambiqueMyanmarNamibiaNauruNepalNetherlandsNew CaledoniaNew ZealandNicaraguaNigerNigeriaNorthern Mariana IslandsNorwayOmanPakistanPalauPanamaPapua New GuineaParaguayPeruPhilippinesPolandPortugalQatarRomaniaRussian FederationRwandaSamoaSao Tome and PrincipeSaudi ArabiaSenegalSerbiaSeychellesSierra LeoneSingaporeSlovak RepublicSloveniaSolomon IslandsSomaliaSouth AfricaSpainSri LankaSt. Kitts and NevisSt. LuciaSt. Vincent and the GrenadinesSudanSurinameSwazilandSwedenSwitzerlandSyrian Arab RepublicTajikistanTanzaniaThailandTogoTongaTrinidad and TobagoTunisiaTurkeyTurkmenistanTurks and Caicos IslandsUgandaUkraineUnited Arab EmiratesUnited KingdomUnited StatesUruguayUzbekistanVanuatuVenezuela, RBVietnamWest Bank and GazaYemen, Rep.ZambiaZimbabwe Timeline:
This timeline shows a graph from 1981 to 2016 of St. Vincent and the Grenadines. No data until 1980. Number of actual observations by date: 36.
Source name:
World Development Indicators
Source organization:
United Nations Conference on Trade and Development, Handbook of Statistics and data files, and International Monetary Fund, International Financial Statistics.
Categories, topics:
Private Sector, Trade
Last updated:
apr 23, 2017
Indicators value changes by year
Minimum:
35.106
jan 1, 1981
Maximum:
228.945
jan 1, 2009
At the date of observation
Value
Absolute change
Change from previous value
jan 1, 1981
35.106
+35.106
0.0%
jan 1, 1982
35.767
+0.66
1.88%
jan 1, 1983
40.024
+4.257
11.9%
jan 1, 1984
43.257
+3.233
8.08%
jan 1, 1985
47.082
+3.825
8.84%
jan 1, 1986
48.698
+1.616
3.43%
jan 1, 1987
53.661
+4.963
10.19%
jan 1, 1988
60.651
+6.989
13.03%
jan 1, 1989
75.153
+14.502
23.91%
jan 1, 1990
78.363
+3.21
4.27%
jan 1, 1991
83.645
+5.282
6.74%
jan 1, 1992
85.862
+2.217
2.65%
jan 1, 1993
81.19
-4.672
-5.44%
jan 1, 1994
82.389
+1.199
1.48%
jan 1, 1995
79.911
-2.477
-3.01%
jan 1, 1996
83.319
+3.408
4.26%
jan 1, 1997
80.89
-2.429
-2.92%
jan 1, 1998
115.178
+34.288
42.39%
jan 1, 1999
118.405
+3.227
2.8%
jan 1, 2000
123.313
+4.908
4.15%
jan 1, 2001
100.0
-23.313
-18.91%
jan 1, 2002
114.061
+14.061
14.06%
jan 1, 2003
106.748
-7.313
-6.41%
jan 1, 2004
123.38
+16.632
15.58%
jan 1, 2005
138.38
+15.0
12.16%
jan 1, 2006
147.506
+9.125
6.59%
jan 1, 2007
166.453
+18.948
12.85%
jan 1, 2008
200.422
+33.969
20.41%
jan 1, 2009
228.945
+28.523
14.23%
jan 1, 2010
204.595
-24.35
-10.64%
jan 1, 2011
207.341
+2.746
1.34%
jan 1, 2012
203.513
-3.828
-1.85%
jan 1, 2013
218.434
+14.92
7.33%
jan 1, 2014
226.994
+8.56
3.92%
jan 1, 2015
222.085
-4.909
-2.16%
jan 1, 2016
204.73
-17.355
-7.81%
Ranking of countries by current statistics by years


Comments: