29
/
en
AIzaSyAYiBZKx7MnpbEhh9jyipgxe19OcubqV5w
April 1, 2024
248838
Sri Lanka
LKA
true
2
1
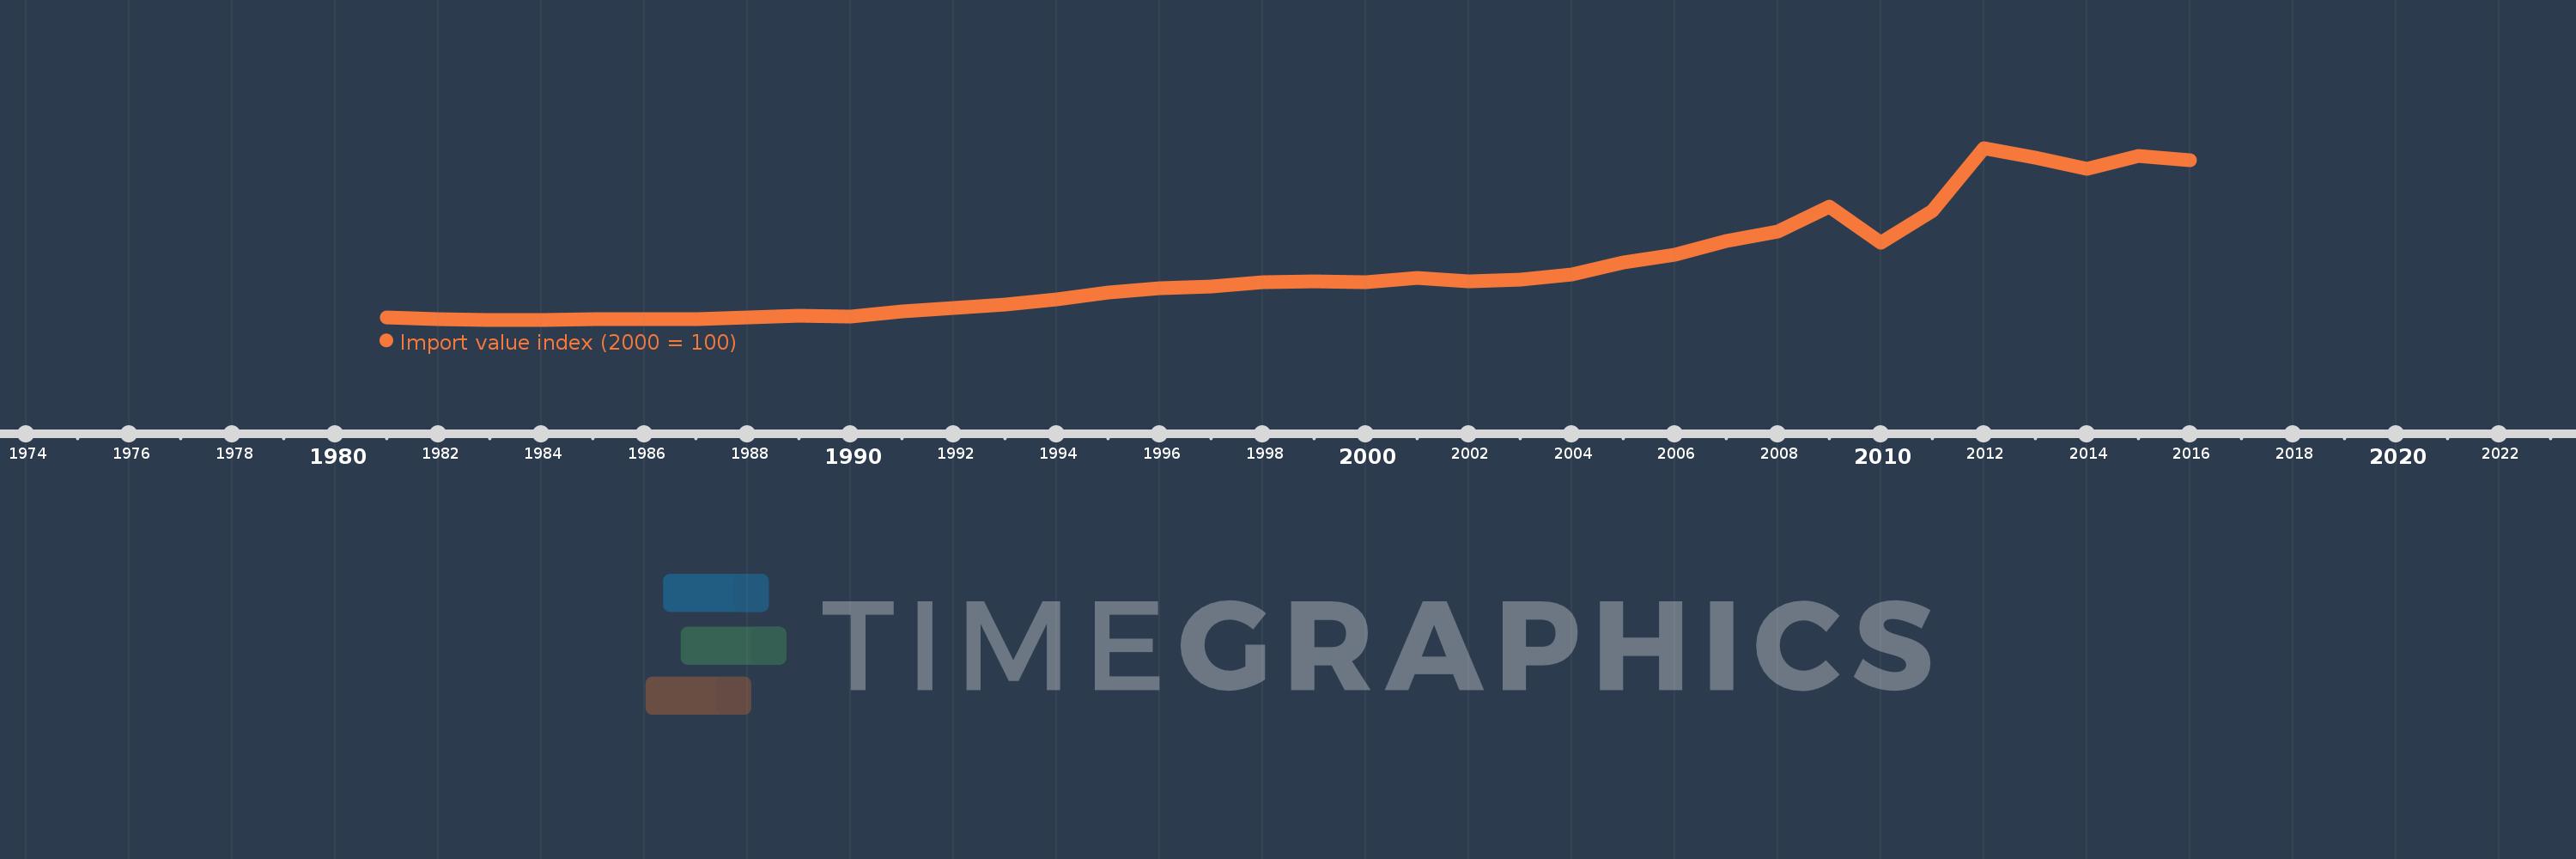
Import value index (2000 = 100)
2016,2015,2014,2013,2012,2011,2010,2009,2008,2007,2006,2005,2004,2003,2002,2001,2000,1999,1998,1997,1996,1995,1994,1993,1992,1991,1990,1989,1988,1987,1986,1985,1984,1983,1982,1981
This statistics in other country:
AfghanistanAlbaniaAlgeriaAmerican SamoaAndorraAngolaAntigua and BarbudaArgentinaArmeniaArubaAustraliaAustriaAzerbaijanBahamas, TheBahrainBangladeshBarbadosBelarusBelgiumBelizeBeninBermudaBhutanBoliviaBosnia and HerzegovinaBotswanaBrazilBritish Virgin IslandsBrunei DarussalamBulgariaBurkina FasoBurundiCabo VerdeCambodiaCameroonCanadaCayman IslandsCentral African RepublicChadChileChinaColombiaComorosCongo, Dem. Rep.Congo, Rep.Costa RicaCote d'IvoireCroatiaCubaCuracaoCyprusCzech RepublicDenmarkDjiboutiDominicaDominican RepublicEcuadorEgypt, Arab Rep.El SalvadorEquatorial GuineaEritreaEstoniaEthiopiaFaroe IslandsFijiFinlandFranceFrench PolynesiaGabonGambia, TheGeorgiaGermanyGhanaGibraltarGreeceGreenlandGrenadaGuamGuatemalaGuineaGuinea-BissauGuyanaHaitiHondurasHong Kong SAR, ChinaHungaryIcelandIndiaIndonesiaIran, Islamic Rep.IraqIrelandIsraelItalyJamaicaJapanJordanKazakhstanKenyaKiribatiKorea, Dem. People’s Rep.Korea, Rep.KuwaitKyrgyz RepublicLao PDRLatviaLebanonLesothoLiberiaLibyaLithuaniaLuxembourgMacao SAR, ChinaMacedonia, FYRMadagascarMalawiMalaysiaMaldivesMaliMaltaMarshall IslandsMauritaniaMauritiusMexicoMicronesia, Fed. Sts.MoldovaMongoliaMoroccoMozambiqueMyanmarNamibiaNauruNepalNetherlandsNew CaledoniaNew ZealandNicaraguaNigerNigeriaNorthern Mariana IslandsNorwayOmanPakistanPalauPanamaPapua New GuineaParaguayPeruPhilippinesPolandPortugalQatarRomaniaRussian FederationRwandaSamoaSao Tome and PrincipeSaudi ArabiaSenegalSerbiaSeychellesSierra LeoneSingaporeSlovak RepublicSloveniaSolomon IslandsSomaliaSouth AfricaSpainSri LankaSt. Kitts and NevisSt. LuciaSt. Vincent and the GrenadinesSudanSurinameSwazilandSwedenSwitzerlandSyrian Arab RepublicTajikistanTanzaniaThailandTogoTongaTrinidad and TobagoTunisiaTurkeyTurkmenistanTurks and Caicos IslandsUgandaUkraineUnited Arab EmiratesUnited KingdomUnited StatesUruguayUzbekistanVanuatuVenezuela, RBVietnamWest Bank and GazaYemen, Rep.ZambiaZimbabwe Timeline:
This timeline shows a graph from 1981 to 2016 of Sri Lanka. No data until 1980. Number of actual observations by date: 36.
Source name:
World Development Indicators
Source organization:
United Nations Conference on Trade and Development, Handbook of Statistics and data files, and International Monetary Fund, International Financial Statistics.
Categories, topics:
Private Sector, Trade
Last updated:
apr 23, 2017
Indicators value changes by year
Maximum:
322.691
jan 1, 2012
At the date of observation
Value
Absolute change
Change from previous value
jan 1, 1981
32.43
+32.43
0.0%
jan 1, 1982
29.431
-2.999
-9.25%
jan 1, 1983
29.151
-0.28
-0.95%
jan 1, 1984
28.97
-0.181
-0.62%
jan 1, 1985
29.716
+0.746
2.57%
jan 1, 1986
29.347
-0.368
-1.24%
jan 1, 1987
29.56
+0.213
0.73%
jan 1, 1988
32.761
+3.2
10.83%
jan 1, 1989
36.007
+3.246
9.91%
jan 1, 1990
34.826
-1.181
-3.28%
jan 1, 1991
42.746
+7.92
22.74%
jan 1, 1992
48.623
+5.876
13.75%
jan 1, 1993
54.841
+6.219
12.79%
jan 1, 1994
63.541
+8.7
15.86%
jan 1, 1995
76.031
+12.49
19.66%
jan 1, 1996
82.551
+6.52
8.57%
jan 1, 1997
86.226
+3.675
4.45%
jan 1, 1998
92.954
+6.728
7.8%
jan 1, 1999
94.46
+1.506
1.62%
jan 1, 2000
93.457
-1.003
-1.06%
jan 1, 2001
100.0
+6.543
7.0%
jan 1, 2002
95.093
-4.907
-4.91%
jan 1, 2003
97.191
+2.098
2.21%
jan 1, 2004
106.22
+9.029
9.29%
jan 1, 2005
126.932
+20.712
19.5%
jan 1, 2006
140.636
+13.704
10.8%
jan 1, 2007
163.315
+22.679
16.13%
jan 1, 2008
179.909
+16.594
10.16%
jan 1, 2009
222.134
+42.226
23.47%
jan 1, 2010
159.988
-62.147
-27.98%
jan 1, 2011
215.109
+55.121
34.45%
jan 1, 2012
322.691
+107.582
50.01%
jan 1, 2013
305.513
-17.178
-5.32%
jan 1, 2014
286.615
-18.898
-6.19%
jan 1, 2015
309.127
+22.511
7.85%
jan 1, 2016
301.447
-7.68
-2.48%
Ranking of countries by current statistics by years


Comments: