29
/
en
AIzaSyAYiBZKx7MnpbEhh9jyipgxe19OcubqV5w
April 1, 2024
84385
Benin
BEN
true
2
1
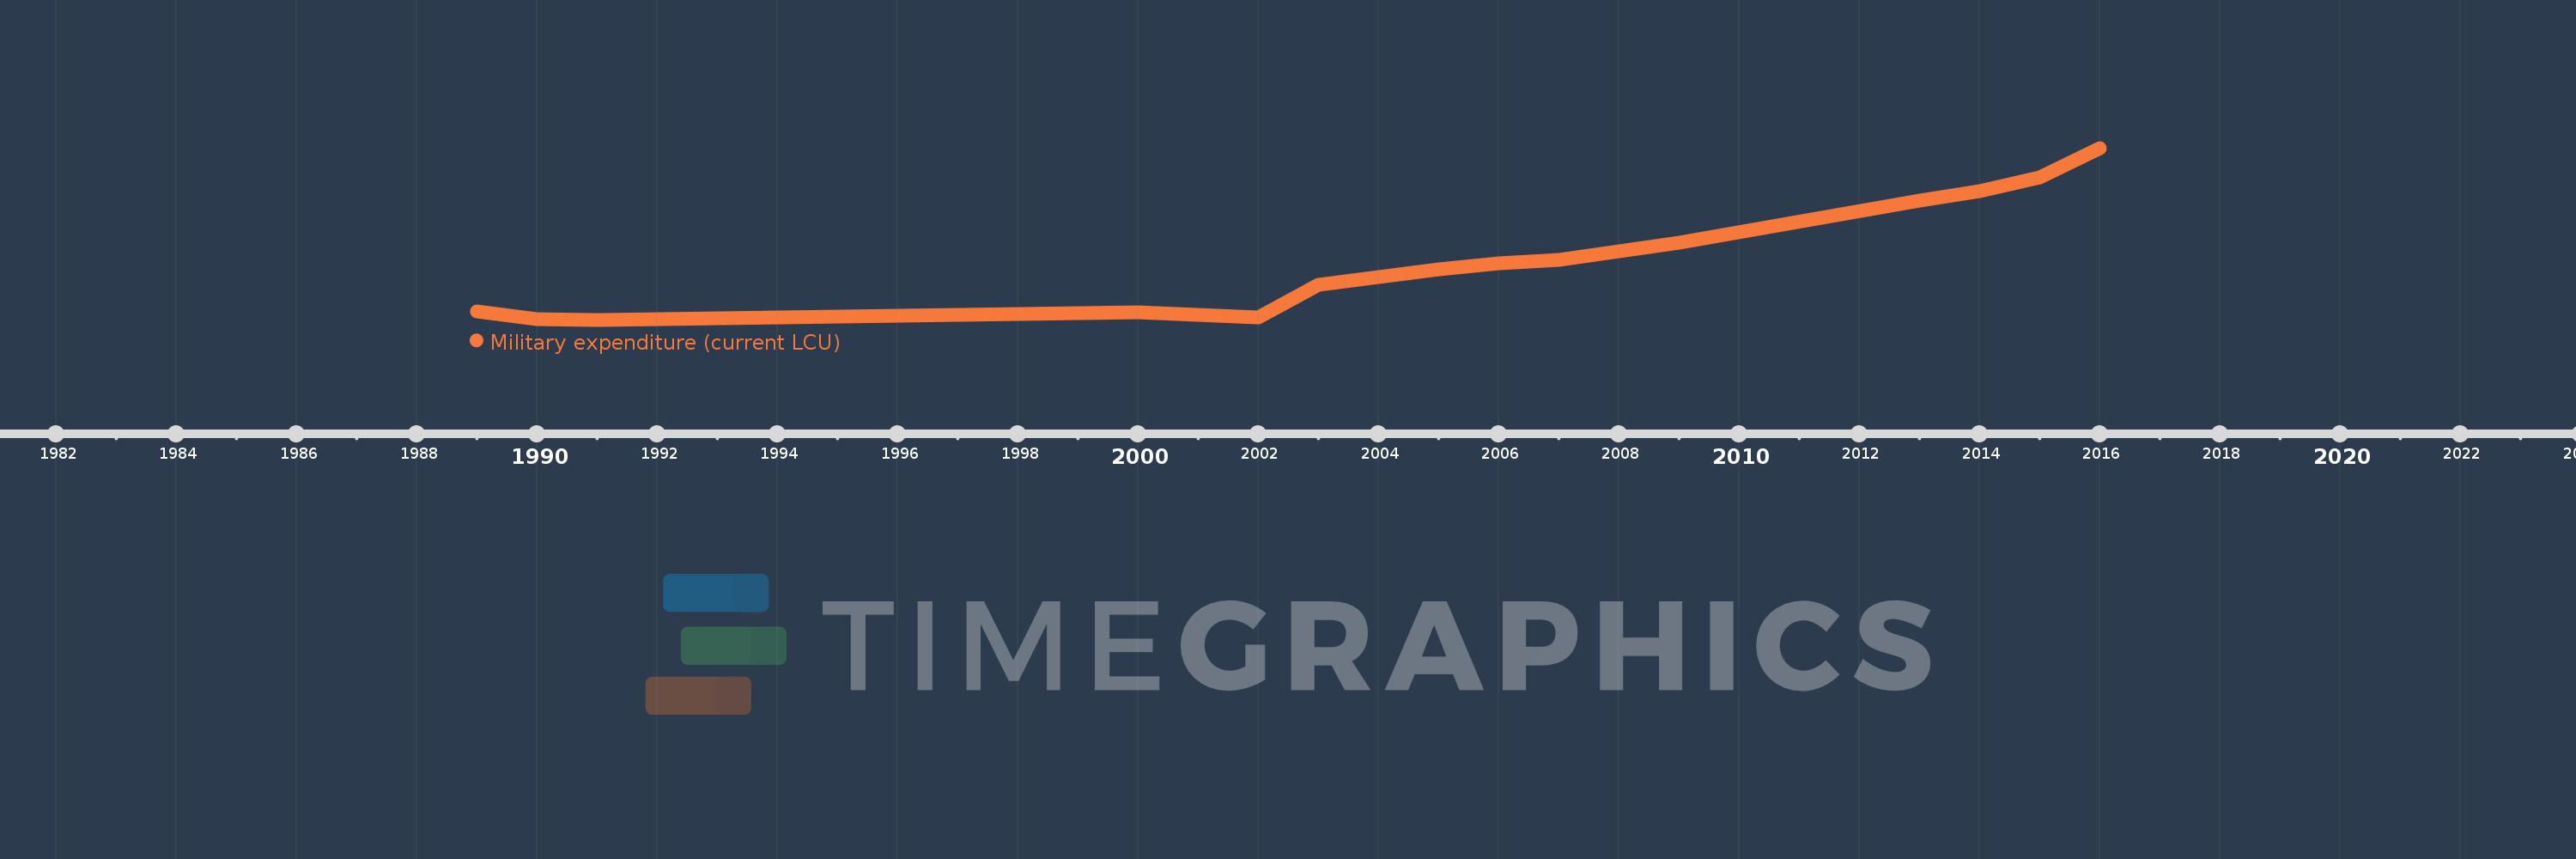
Military expenditure (current LCU)
2016,2015,2014,2013,2009,2007,2006,2005,2004,2003,2002,2001,2000,1991,1990,1989
This statistics in other country:
AfghanistanAlbaniaAlgeriaAngolaArgentinaArmeniaAustraliaAustriaAzerbaijanBahrainBangladeshBelarusBelgiumBelizeBeninBoliviaBosnia and HerzegovinaBotswanaBrazilBrunei DarussalamBulgariaBurkina FasoBurundiCabo VerdeCambodiaCameroonCanadaCentral African RepublicChadChileChinaColombiaCongo, Dem. Rep.Congo, Rep.Costa RicaCote d'IvoireCroatiaCubaCyprusCzech RepublicDenmarkDjiboutiDominican RepublicEcuadorEgypt, Arab Rep.El SalvadorEquatorial GuineaEritreaEstoniaEthiopiaFijiFinlandFranceGabonGambia, TheGeorgiaGermanyGhanaGreeceGuatemalaGuineaGuinea-BissauGuyanaHaitiHondurasHungaryIcelandIndiaIndonesiaIran, Islamic Rep.IraqIrelandIsraelItalyJamaicaJapanJordanKazakhstanKenyaKorea, Dem. People’s Rep.Korea, Rep.KosovoKuwaitKyrgyz RepublicLao PDRLatviaLebanonLesothoLiberiaLibyaLithuaniaLuxembourgMacedonia, FYRMadagascarMalawiMalaysiaMaliMaltaMauritaniaMauritiusMexicoMoldovaMongoliaMontenegroMoroccoMozambiqueMyanmarNamibiaNepalNetherlandsNew ZealandNicaraguaNigerNigeriaNorwayOmanPakistanPanamaPapua New GuineaParaguayPeruPhilippinesPolandPortugalQatarRomaniaRussian FederationRwandaSaudi ArabiaSenegalSerbiaSeychellesSierra LeoneSingaporeSlovak RepublicSloveniaSomaliaSouth AfricaSouth SudanSpainSri LankaSudanSwazilandSwedenSwitzerlandSyrian Arab RepublicTajikistanTanzaniaThailandTimor-LesteTogoTrinidad and TobagoTunisiaTurkeyTurkmenistanUgandaUkraineUnited Arab EmiratesUnited KingdomUnited StatesUruguayUzbekistanVenezuela, RBVietnamYemen, Rep.ZambiaZimbabwe Timeline:
This timeline shows a graph from 1989 to 2016 of Benin. No data until 1988. Number of actual observations by date: 16.
Source name:
World Development Indicators
Source organization:
Stockholm International Peace Research Institute (SIPRI), Yearbook: Armaments, Disarmament and International Security.
Categories, topics:
Public Sector
Last updated:
apr 23, 2017
Indicators value changes by year
Minimum:
8.935 bln
jan 1, 1991
Maximum:
53.76 bln
jan 1, 2016
At the date of observation
Value
Absolute change
Change from previous value
jan 1, 1989
11.0 bln
+11.0 bln
0.0%
jan 1, 1990
9.1 bln
-1.9 bln
-17.27%
jan 1, 1991
8.935 bln
-165.0 mln
-1.81%
jan 1, 2000
10.986 bln
+2.051 bln
22.95%
jan 1, 2001
10.321 bln
-665.0 mln
-6.05%
jan 1, 2002
9.612 bln
-709.0 mln
-6.87%
jan 1, 2003
18.122 bln
+8.51 bln
88.54%
jan 1, 2004
20.077 bln
+1.955 bln
10.79%
jan 1, 2005
22.072 bln
+1.995 bln
9.94%
jan 1, 2006
23.581 bln
+1.509 bln
6.84%
jan 1, 2007
24.464 bln
+883.0 mln
3.74%
jan 1, 2009
28.984 bln
+4.52 bln
18.48%
jan 1, 2013
39.935 bln
+10.951 bln
37.78%
jan 1, 2014
42.489 bln
+2.554 bln
6.4%
jan 1, 2015
45.976 bln
+3.487 bln
8.21%
jan 1, 2016
53.76 bln
+7.784 bln
16.93%
Ranking of countries by current statistics by years


Comments: