29
/
en
AIzaSyAYiBZKx7MnpbEhh9jyipgxe19OcubqV5w
April 1, 2024
120127
Djibouti
DJI
true
2
1
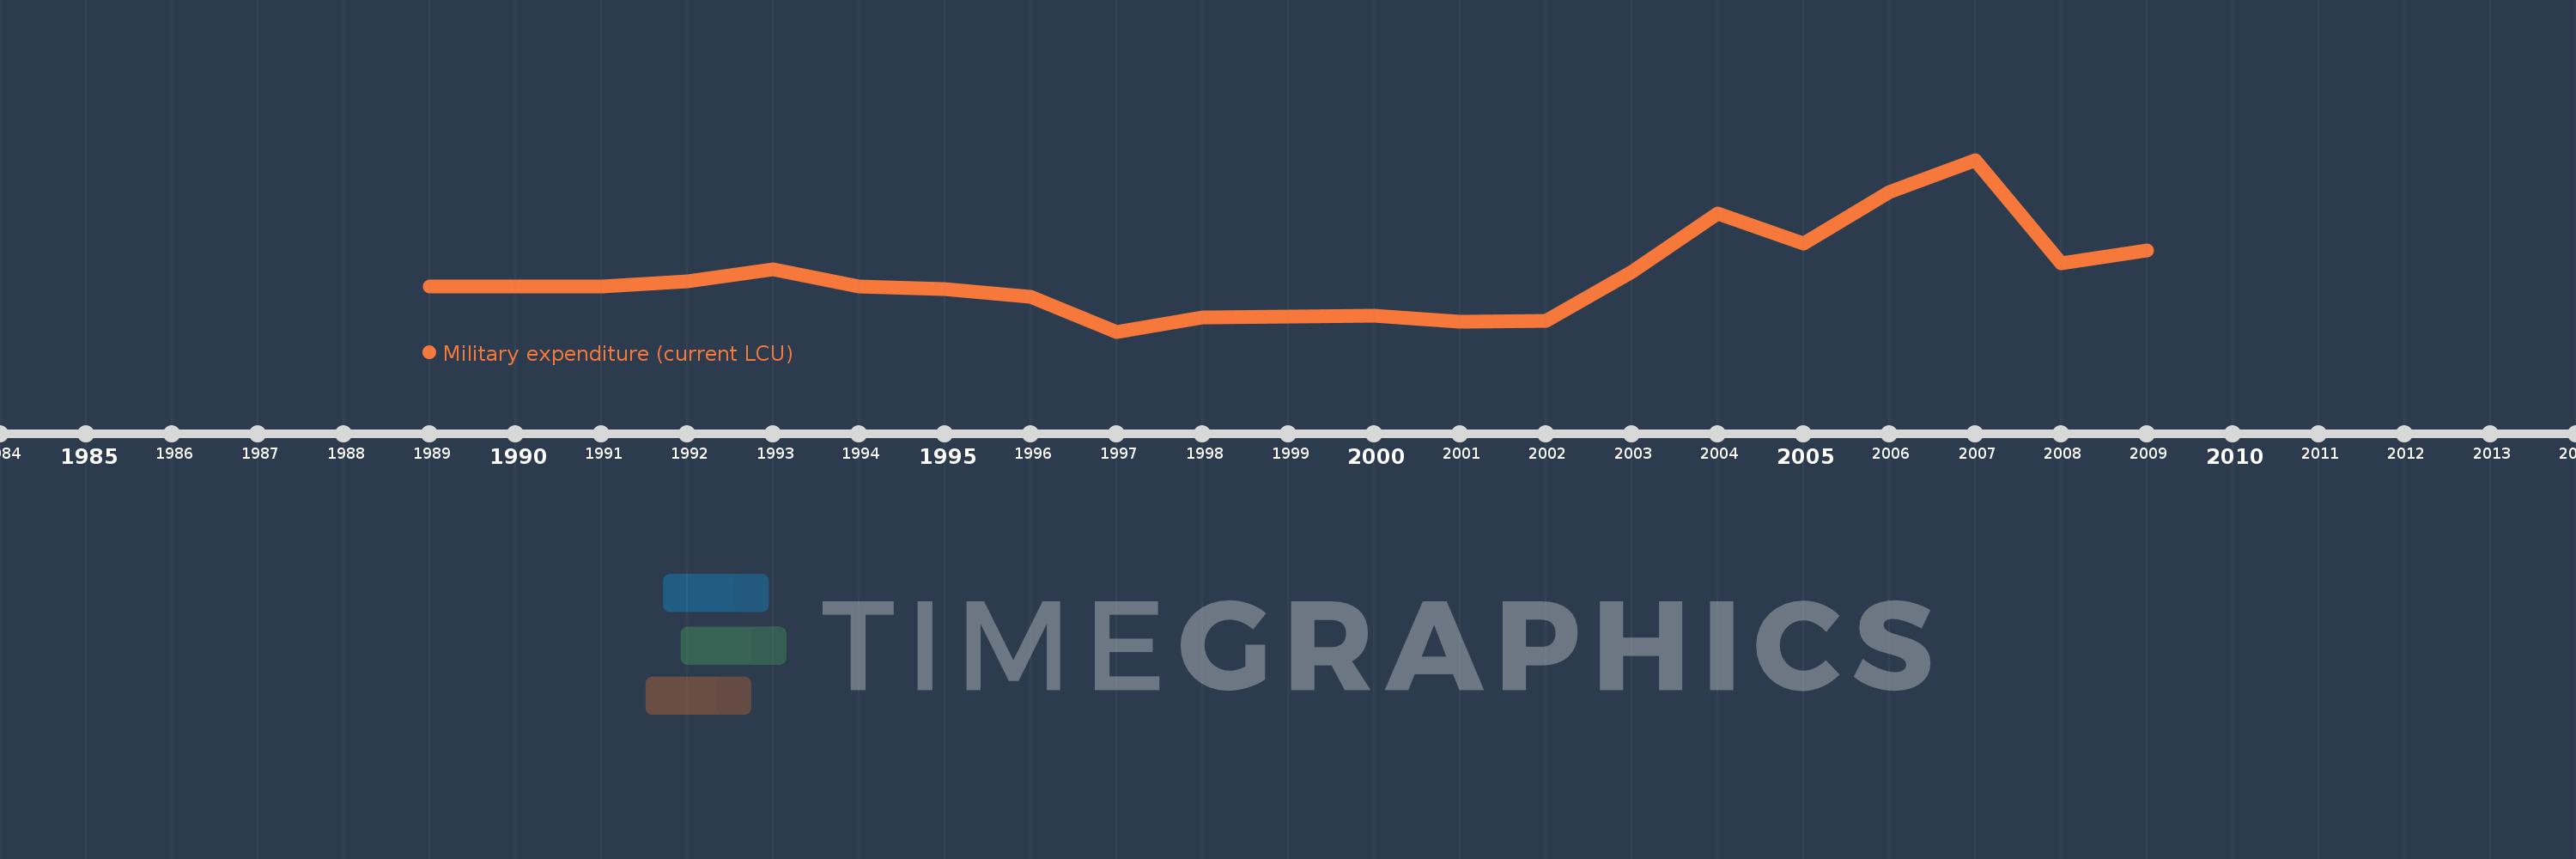
Military expenditure (current LCU)
2009,2008,2007,2006,2005,2004,2003,2002,2001,2000,1999,1998,1997,1996,1995,1994,1993,1992,1991,1990,1989
This statistics in other country:
AfghanistanAlbaniaAlgeriaAngolaArgentinaArmeniaAustraliaAustriaAzerbaijanBahrainBangladeshBelarusBelgiumBelizeBeninBoliviaBosnia and HerzegovinaBotswanaBrazilBrunei DarussalamBulgariaBurkina FasoBurundiCabo VerdeCambodiaCameroonCanadaCentral African RepublicChadChileChinaColombiaCongo, Dem. Rep.Congo, Rep.Costa RicaCote d'IvoireCroatiaCubaCyprusCzech RepublicDenmarkDjiboutiDominican RepublicEcuadorEgypt, Arab Rep.El SalvadorEquatorial GuineaEritreaEstoniaEthiopiaFijiFinlandFranceGabonGambia, TheGeorgiaGermanyGhanaGreeceGuatemalaGuineaGuinea-BissauGuyanaHaitiHondurasHungaryIcelandIndiaIndonesiaIran, Islamic Rep.IraqIrelandIsraelItalyJamaicaJapanJordanKazakhstanKenyaKorea, Dem. People’s Rep.Korea, Rep.KosovoKuwaitKyrgyz RepublicLao PDRLatviaLebanonLesothoLiberiaLibyaLithuaniaLuxembourgMacedonia, FYRMadagascarMalawiMalaysiaMaliMaltaMauritaniaMauritiusMexicoMoldovaMongoliaMontenegroMoroccoMozambiqueMyanmarNamibiaNepalNetherlandsNew ZealandNicaraguaNigerNigeriaNorwayOmanPakistanPanamaPapua New GuineaParaguayPeruPhilippinesPolandPortugalQatarRomaniaRussian FederationRwandaSaudi ArabiaSenegalSerbiaSeychellesSierra LeoneSingaporeSlovak RepublicSloveniaSomaliaSouth AfricaSouth SudanSpainSri LankaSudanSwazilandSwedenSwitzerlandSyrian Arab RepublicTajikistanTanzaniaThailandTimor-LesteTogoTrinidad and TobagoTunisiaTurkeyTurkmenistanUgandaUkraineUnited Arab EmiratesUnited KingdomUnited StatesUruguayUzbekistanVenezuela, RBVietnamYemen, Rep.ZambiaZimbabwe Timeline:
This timeline shows a graph from 1989 to 2009 of Djibouti. No data until 1988. Number of actual observations by date: 21.
Source name:
World Development Indicators
Source organization:
Stockholm International Peace Research Institute (SIPRI), Yearbook: Armaments, Disarmament and International Security.
Categories, topics:
Public Sector
Last updated:
apr 23, 2017
Indicators value changes by year
Minimum:
4.359 bln
jan 1, 1997
Maximum:
8.8 bln
jan 1, 2007
At the date of observation
Value
Absolute change
Change from previous value
jan 1, 1989
5.52 bln
+5.52 bln
0.0%
jan 1, 1990
5.525 bln
+5.0 mln
0.09%
jan 1, 1991
5.53 bln
+5.0 mln
0.09%
jan 1, 1992
5.647 bln
+117.0 mln
2.12%
jan 1, 1993
5.976 bln
+329.0 mln
5.83%
jan 1, 1994
5.521 bln
-455.0 mln
-7.61%
jan 1, 1995
5.458 bln
-63.0 mln
-1.14%
jan 1, 1996
5.262 bln
-196.0 mln
-3.59%
jan 1, 1997
4.359 bln
-903.0 mln
-17.16%
jan 1, 1998
4.719 bln
+360.0 mln
8.26%
jan 1, 1999
4.746 bln
+27.0 mln
0.57%
jan 1, 2000
4.759 bln
+13.2 mln
0.28%
jan 1, 2001
4.625 bln
-134.0 mln
-2.82%
jan 1, 2002
4.629 bln
+4.1 mln
0.09%
jan 1, 2003
5.909 bln
+1.28 bln
27.65%
jan 1, 2004
7.422 bln
+1.513 bln
25.6%
jan 1, 2005
6.639 bln
-783.4 mln
-10.55%
jan 1, 2006
7.97 bln
+1.331 bln
20.05%
jan 1, 2007
8.8 bln
+829.7 mln
10.41%
jan 1, 2008
6.135 bln
-2.665 bln
-30.29%
jan 1, 2009
6.447 bln
+312.1 mln
5.09%
Ranking of countries by current statistics by years


Comments: