29
/
en
AIzaSyAYiBZKx7MnpbEhh9jyipgxe19OcubqV5w
April 1, 2024
63754
Afghanistan
AFG
true
2
1
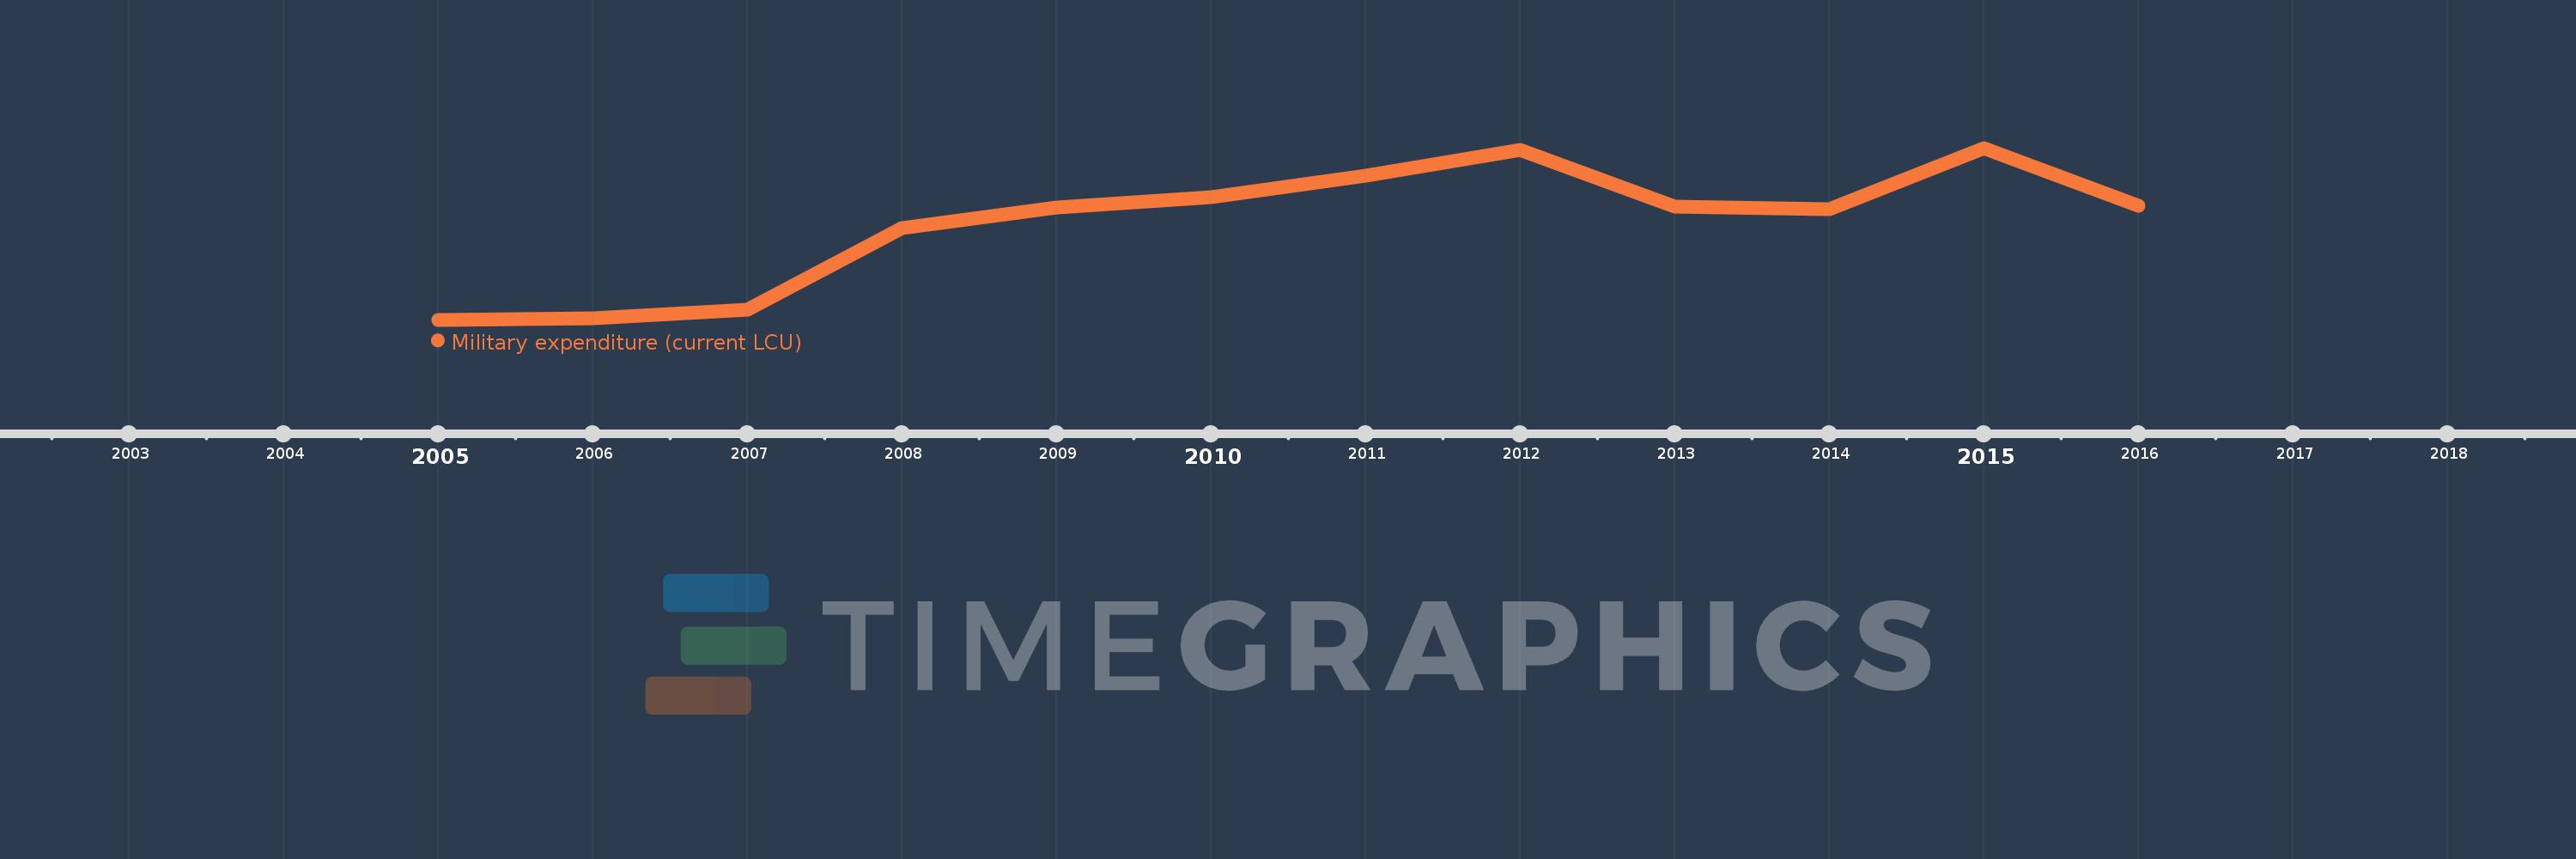
Military expenditure (current LCU)
2016,2015,2014,2013,2012,2011,2010,2009,2008,2007,2006,2005
This statistics in other country:
AfghanistanAlbaniaAlgeriaAngolaArgentinaArmeniaAustraliaAustriaAzerbaijanBahrainBangladeshBelarusBelgiumBelizeBeninBoliviaBosnia and HerzegovinaBotswanaBrazilBrunei DarussalamBulgariaBurkina FasoBurundiCabo VerdeCambodiaCameroonCanadaCentral African RepublicChadChileChinaColombiaCongo, Dem. Rep.Congo, Rep.Costa RicaCote d'IvoireCroatiaCubaCyprusCzech RepublicDenmarkDjiboutiDominican RepublicEcuadorEgypt, Arab Rep.El SalvadorEquatorial GuineaEritreaEstoniaEthiopiaFijiFinlandFranceGabonGambia, TheGeorgiaGermanyGhanaGreeceGuatemalaGuineaGuinea-BissauGuyanaHaitiHondurasHungaryIcelandIndiaIndonesiaIran, Islamic Rep.IraqIrelandIsraelItalyJamaicaJapanJordanKazakhstanKenyaKorea, Dem. People’s Rep.Korea, Rep.KosovoKuwaitKyrgyz RepublicLao PDRLatviaLebanonLesothoLiberiaLibyaLithuaniaLuxembourgMacedonia, FYRMadagascarMalawiMalaysiaMaliMaltaMauritaniaMauritiusMexicoMoldovaMongoliaMontenegroMoroccoMozambiqueMyanmarNamibiaNepalNetherlandsNew ZealandNicaraguaNigerNigeriaNorwayOmanPakistanPanamaPapua New GuineaParaguayPeruPhilippinesPolandPortugalQatarRomaniaRussian FederationRwandaSaudi ArabiaSenegalSerbiaSeychellesSierra LeoneSingaporeSlovak RepublicSloveniaSomaliaSouth AfricaSouth SudanSpainSri LankaSudanSwazilandSwedenSwitzerlandSyrian Arab RepublicTajikistanTanzaniaThailandTimor-LesteTogoTrinidad and TobagoTunisiaTurkeyTurkmenistanUgandaUkraineUnited Arab EmiratesUnited KingdomUnited StatesUruguayUzbekistanVenezuela, RBVietnamYemen, Rep.ZambiaZimbabwe Timeline:
This timeline shows a graph from 2005 to 2016 of Afghanistan. No data until 2004. Number of actual observations by date: 12.
Source name:
World Development Indicators
Source organization:
Stockholm International Peace Research Institute (SIPRI), Yearbook: Armaments, Disarmament and International Security.
Categories, topics:
Public Sector
Last updated:
apr 23, 2017
Indicators value changes by year
Minimum:
5.986 bln
jan 1, 2005
Maximum:
15.356 bln
jan 1, 2015
At the date of observation
Value
Absolute change
Change from previous value
jan 1, 2005
5.986 bln
+5.986 bln
0.0%
jan 1, 2006
6.074 bln
+88.333 mln
1.48%
jan 1, 2007
6.558 bln
+483.167 mln
7.95%
jan 1, 2008
10.971 bln
+4.413 bln
67.3%
jan 1, 2009
12.087 bln
+1.116 bln
10.17%
jan 1, 2010
12.675 bln
+588.667 mln
4.87%
jan 1, 2011
13.85 bln
+1.174 bln
9.26%
jan 1, 2012
15.23 bln
+1.381 bln
9.97%
jan 1, 2013
12.149 bln
-3.082 bln
-20.23%
jan 1, 2014
12.028 bln
-121.333 mln
-1.0%
jan 1, 2015
15.356 bln
+3.328 bln
27.67%
jan 1, 2016
12.199 bln
-3.157 bln
-20.56%
Ranking of countries by current statistics by years


Comments: