29
/
en
AIzaSyAYiBZKx7MnpbEhh9jyipgxe19OcubqV5w
April 1, 2024
80237
Belarus
BLR
true
2
1
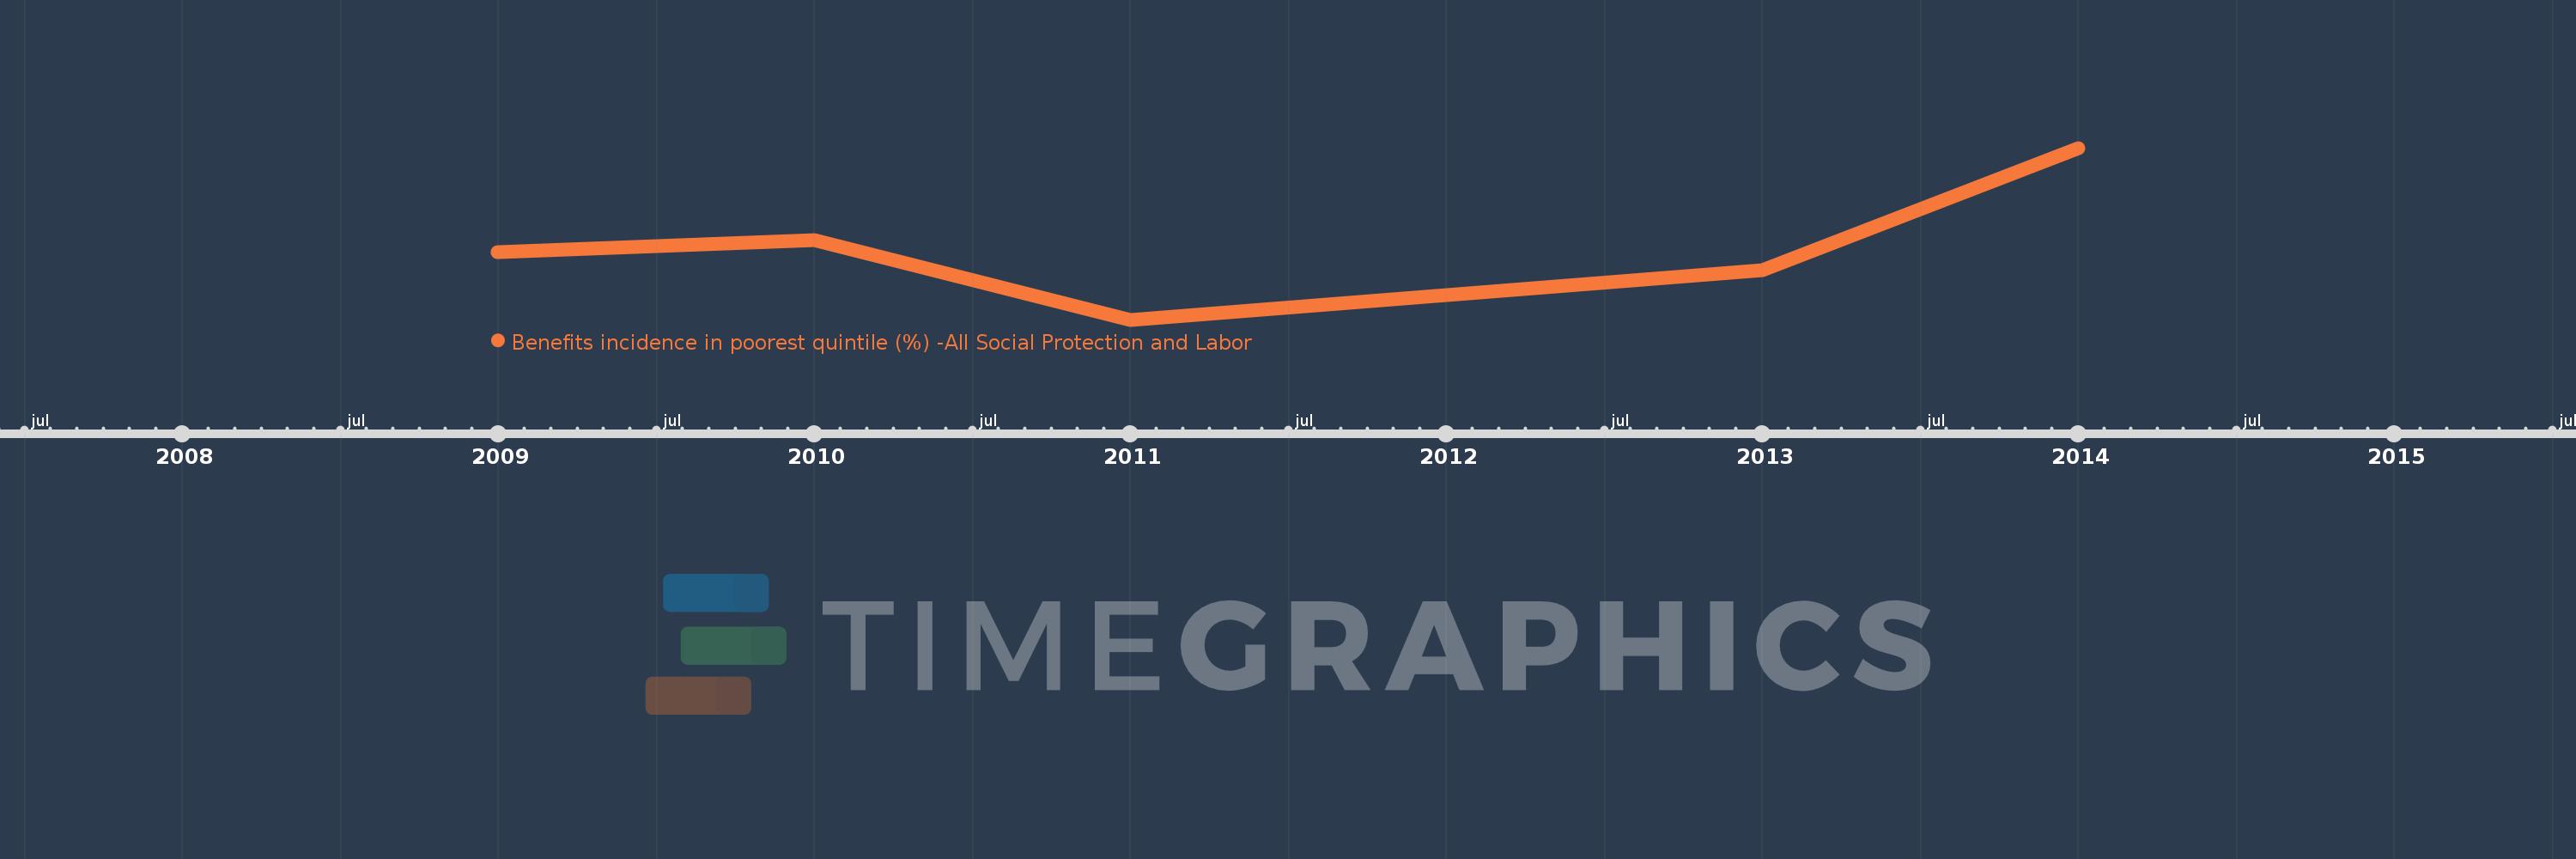
Benefits incidence in poorest quintile (%) -All Social Protection and Labor
2014,2013,2011,2010,2009
This statistics in other country:
Timeline:
This timeline shows a graph from 2009 to 2014 of Belarus. No data until 2008. Number of actual observations by date: 5.
Source name:
World Development Indicators
Source organization:
The Atlas of Social Protection: Indicators of Resilience and Equity (ASPIRE)
Categories, topics:
Social Protection & Labor
Last updated:
apr 23, 2017
Indicators value changes by year
Minimum:
13.986
jan 1, 2011
Maximum:
15.919
jan 1, 2014
At the date of observation
Value
Absolute change
Change from previous value
jan 1, 2009
14.748
+14.748
0.0%
jan 1, 2010
14.885
+0.137
0.93%
jan 1, 2011
13.986
-0.899
-6.04%
jan 1, 2013
14.545
+0.559
3.99%
jan 1, 2014
15.919
+1.374
9.45%
Ranking of countries by current statistics by years


Comments: