29
/
en
AIzaSyAYiBZKx7MnpbEhh9jyipgxe19OcubqV5w
April 1, 2024
69506
Argentina
ARG
true
2
1
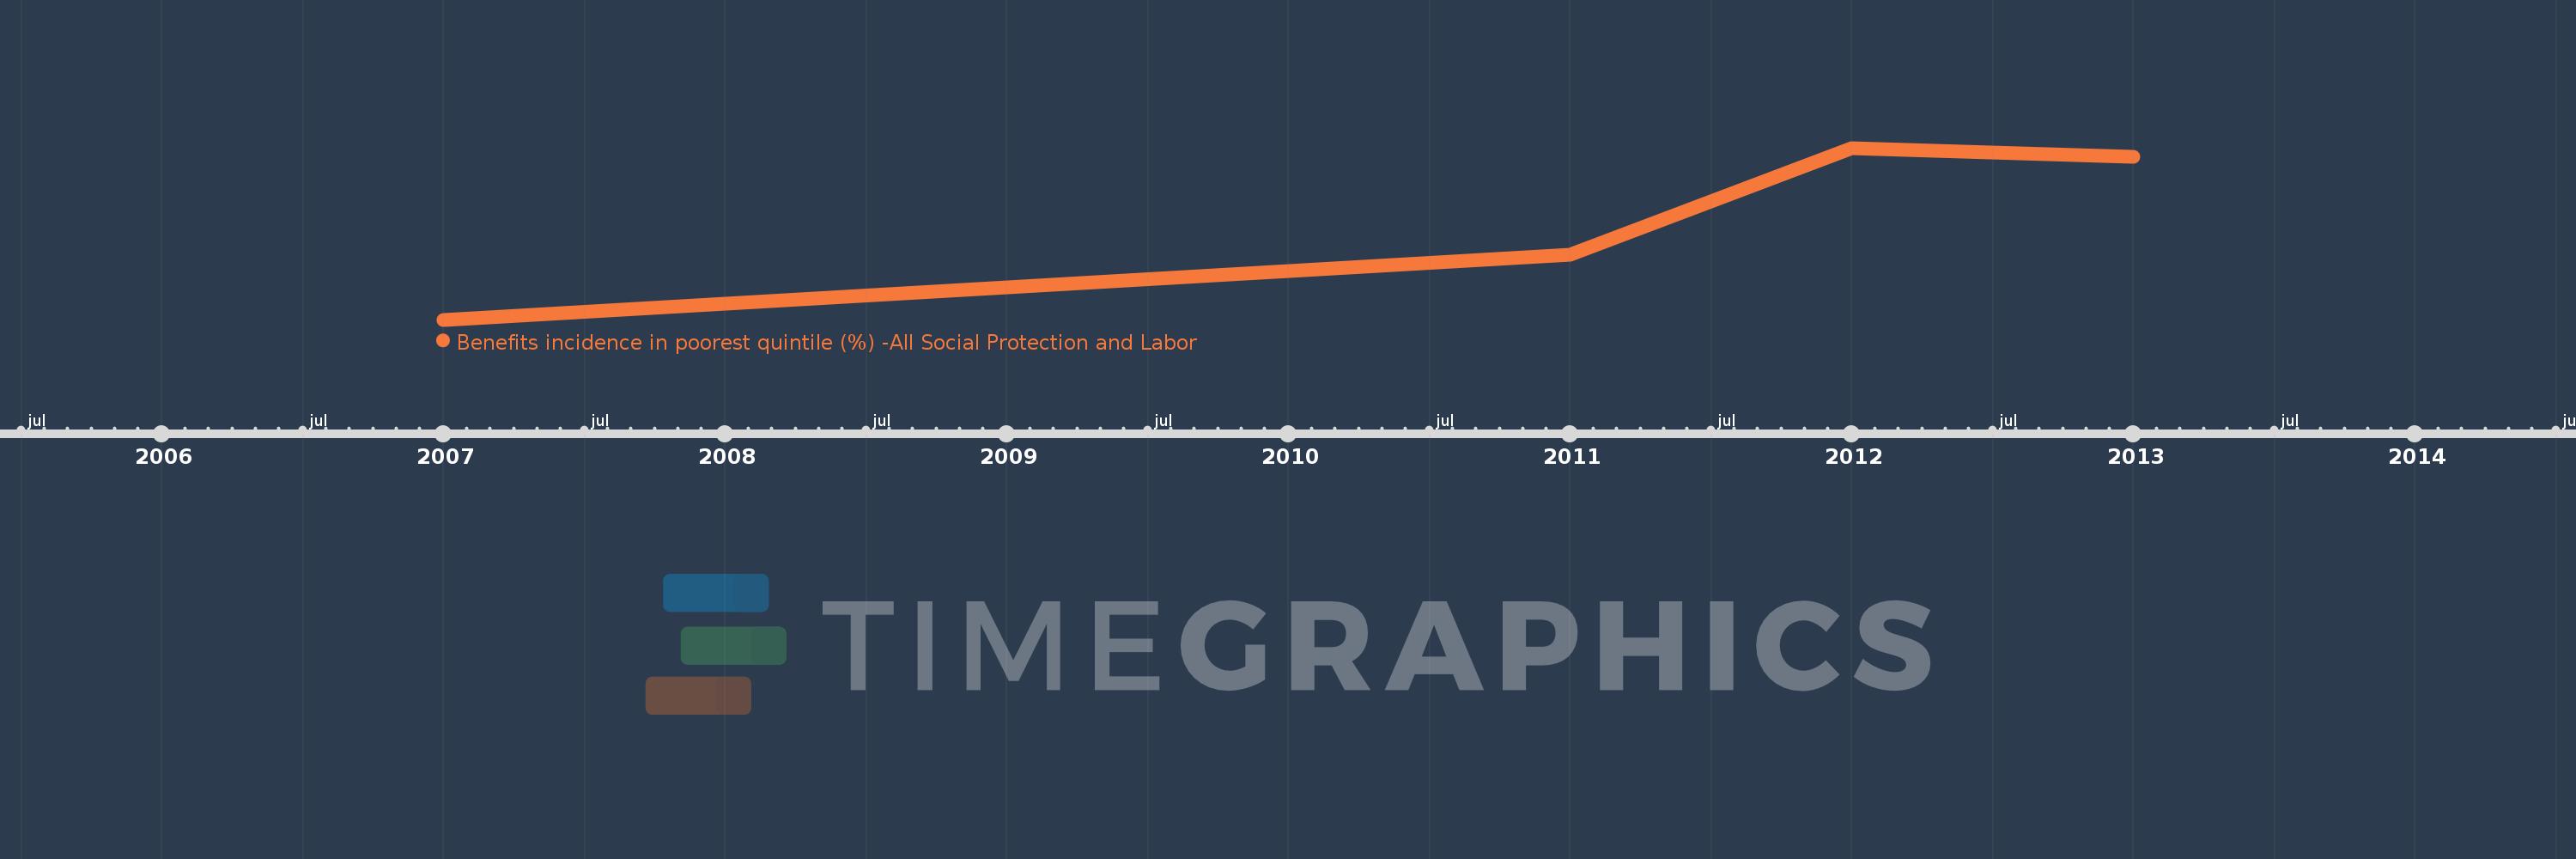
Benefits incidence in poorest quintile (%) -All Social Protection and Labor
2013,2012,2011,2007
This statistics in other country:
Timeline:
This timeline shows a graph from 2007 to 2013 of Argentina. No data until 2006. Number of actual observations by date: 4.
Source name:
World Development Indicators
Source organization:
The Atlas of Social Protection: Indicators of Resilience and Equity (ASPIRE)
Categories, topics:
Social Protection & Labor
Last updated:
apr 23, 2017
Indicators value changes by year
Maximum:
10.851
jan 1, 2012
At the date of observation
Value
Absolute change
Change from previous value
jan 1, 2007
2.777
+2.777
0.0%
jan 1, 2011
5.84
+3.063
110.31%
jan 1, 2012
10.851
+5.011
85.8%
jan 1, 2013
10.429
-0.422
-3.89%
Ranking of countries by current statistics by years


Comments: