Download This statistics in other country:
Timeline:
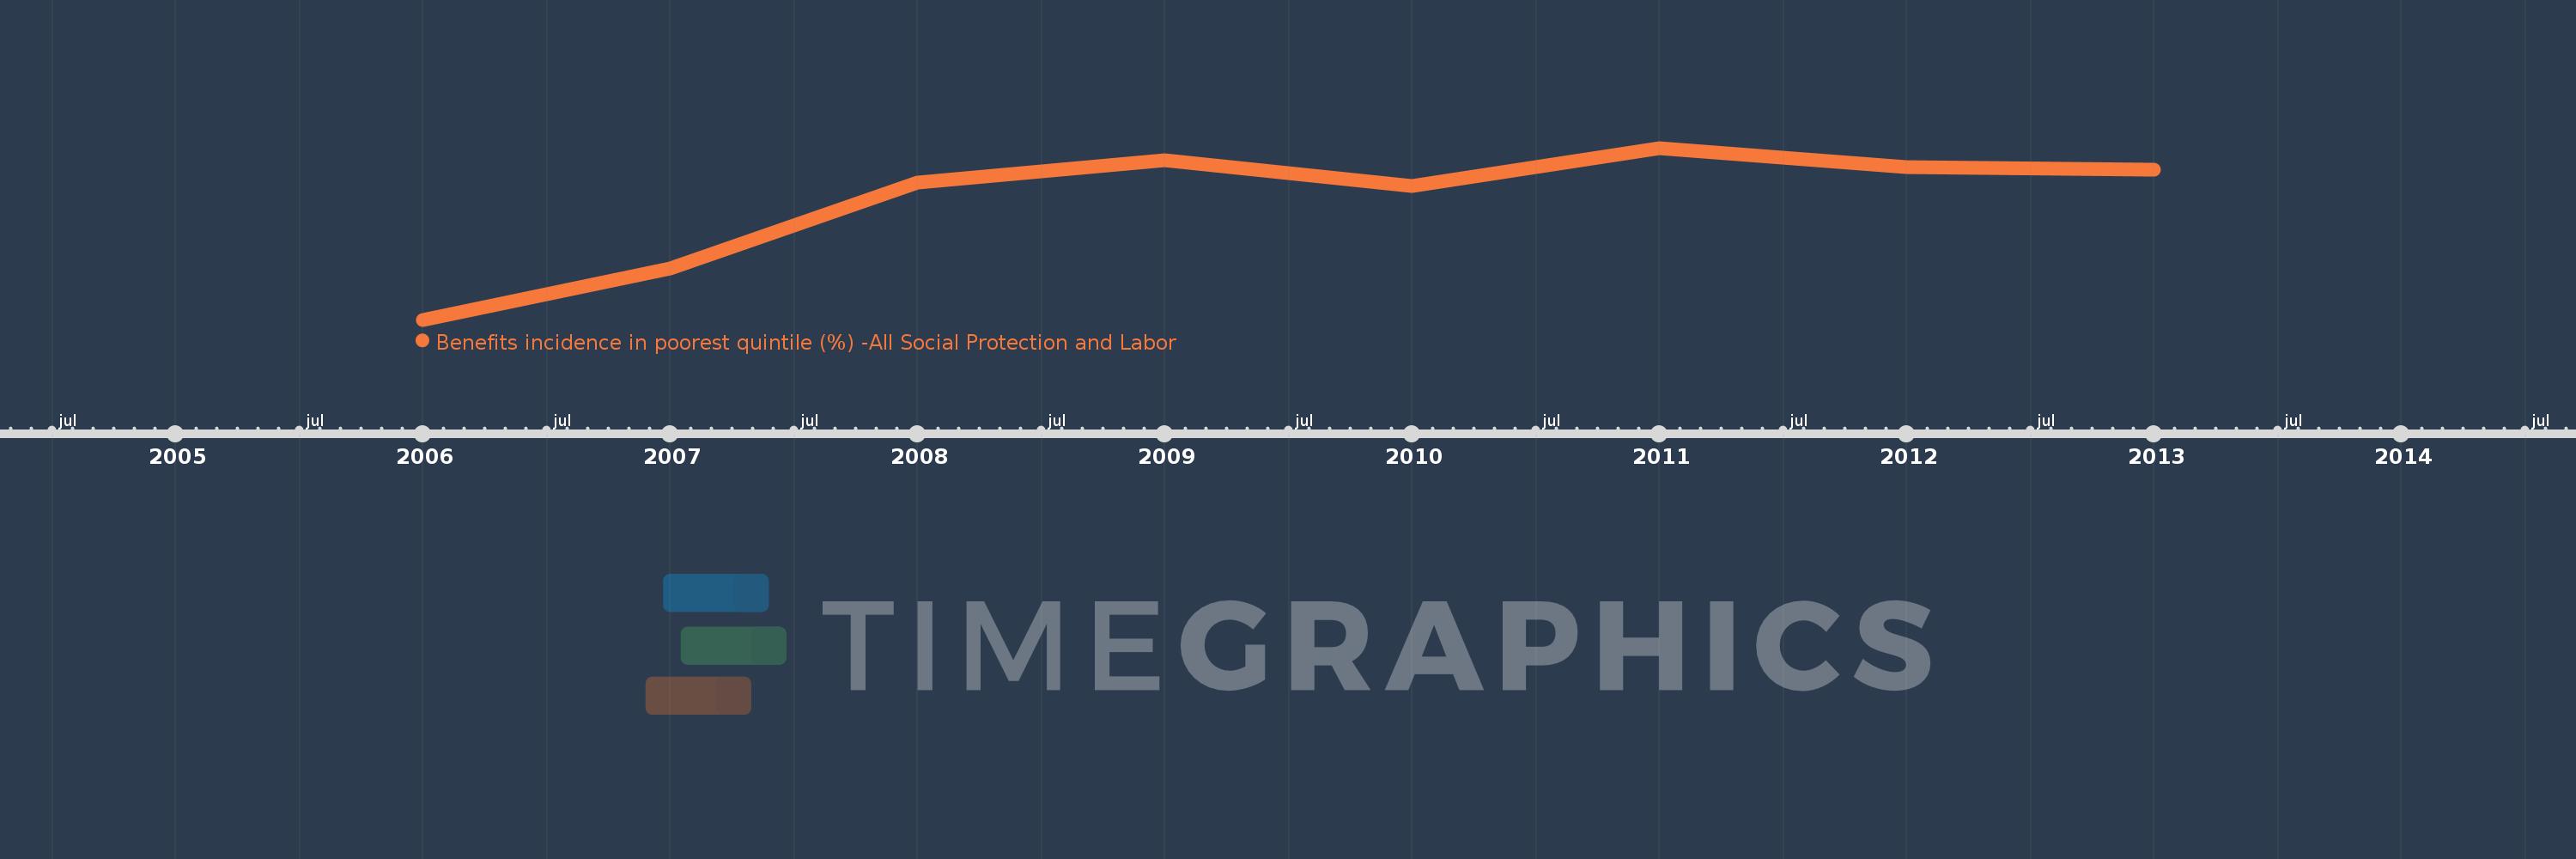
This timeline shows a graph from 2006 to 2013 of Poland. No data until 2005. Number of actual observations by date: 8.
Source name:
World Development Indicators
Source organization:
The Atlas of Social Protection: Indicators of Resilience and Equity (ASPIRE)
Categories, topics:
Social Protection & Labor
Last updated:
apr 23, 2017
Indicators value changes by year
Maximum:
11.765
jan 1, 2011
At the date of observation
Value
Absolute change
Change from the previous value
jan 1, 2006
9.955
+9.955
0.0%
jan 1, 2007
10.496
+0.541
5.43%
jan 1, 2008
11.402
+0.906
8.64%
jan 1, 2009
11.638
+0.236
2.07%
jan 1, 2010
11.366
-0.272
-2.34%
jan 1, 2011
11.765
+0.399
3.51%
jan 1, 2012
11.564
-0.201
-1.71%
jan 1, 2013
11.535
-0.029
-0.25%
Ranking of countries by current statistics by years
