29
/
en
AIzaSyAYiBZKx7MnpbEhh9jyipgxe19OcubqV5w
April 1, 2024
76038
Bahamas, The
BHS
true
2
1
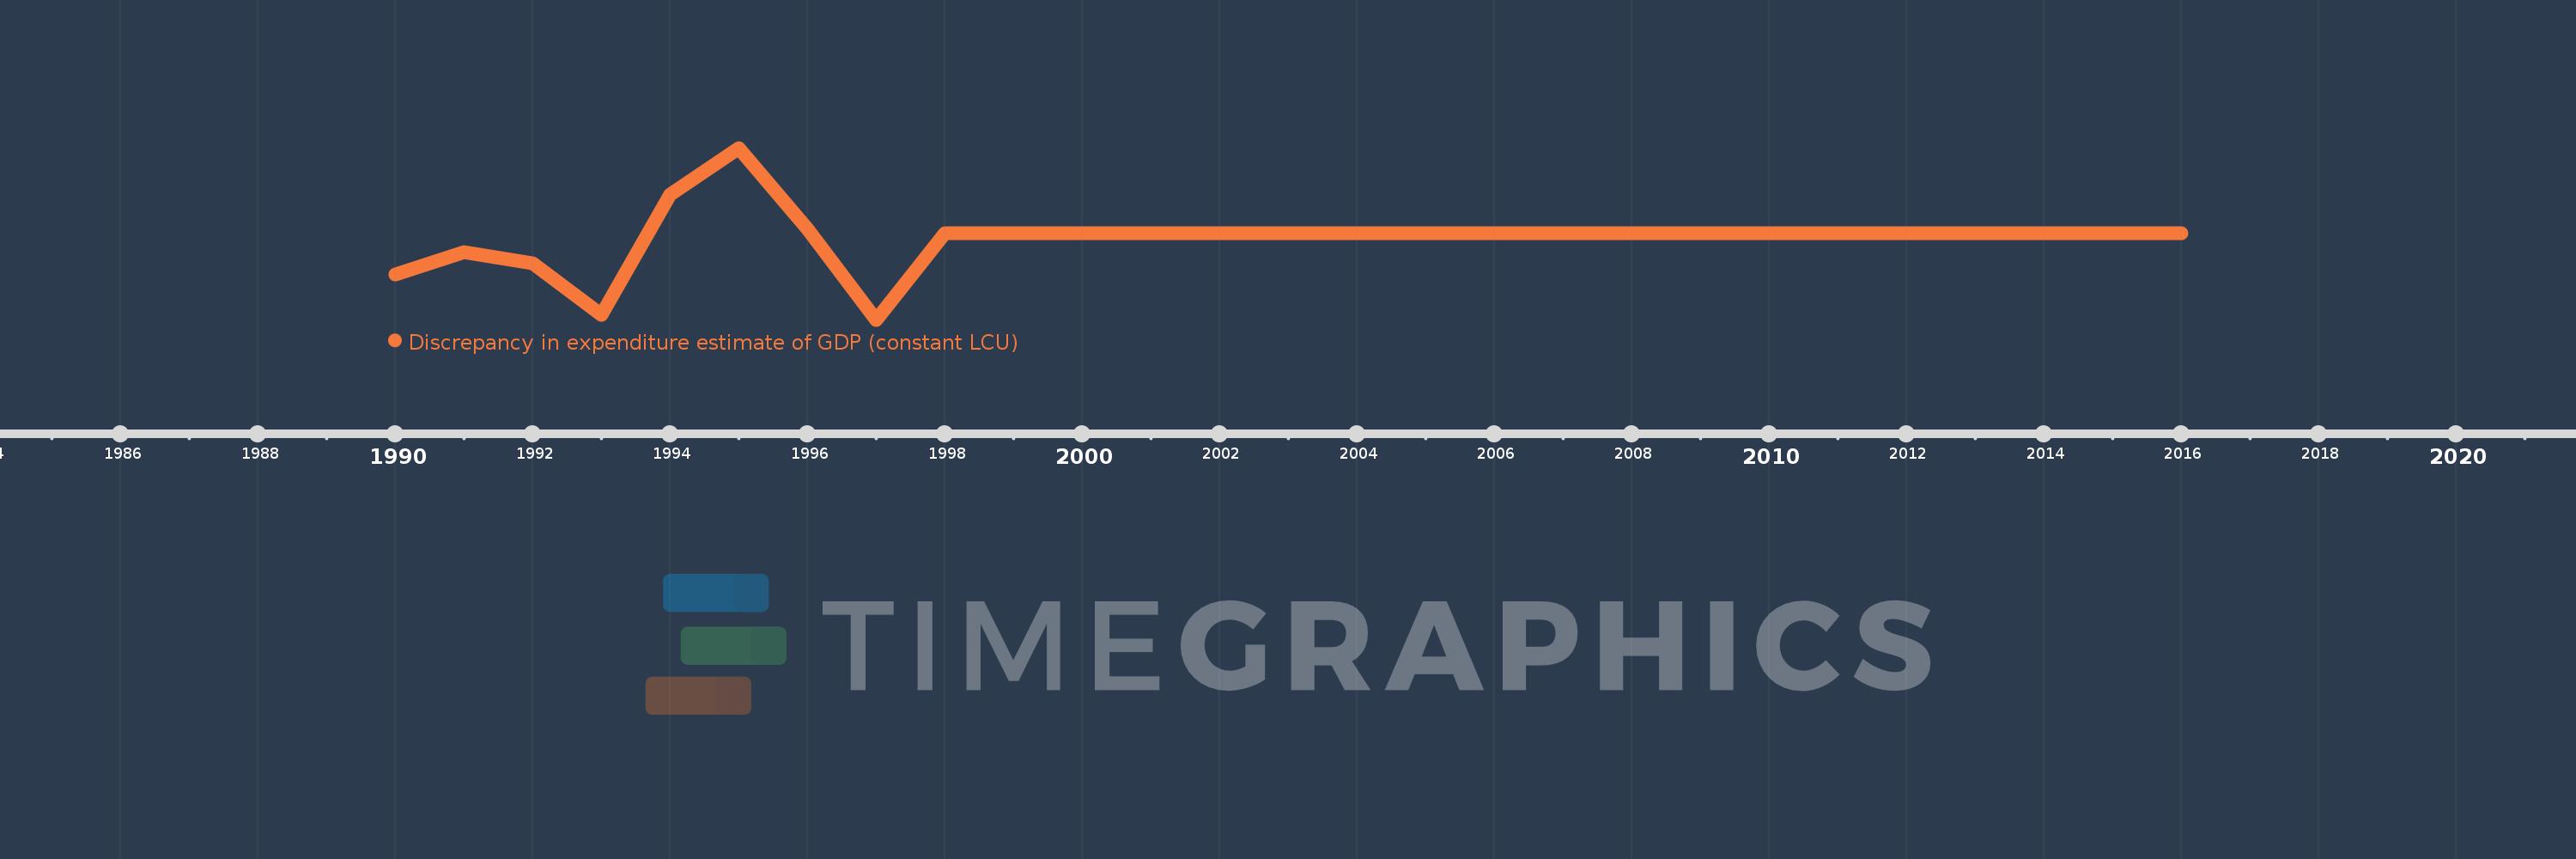
Discrepancy in expenditure estimate of GDP (constant LCU)
2016,2014,2013,2012,2011,2010,2009,2008,2007,2006,2005,2004,2003,2002,2001,2000,1999,1998,1997,1996,1995,1994,1993,1992,1991,1990
This statistics in other country:
AlbaniaAlgeriaAngolaAntigua and BarbudaArgentinaArmeniaAustraliaAustriaAzerbaijanBahamas, TheBahrainBangladeshBarbadosBelarusBelgiumBelizeBeninBhutanBoliviaBosnia and HerzegovinaBotswanaBrazilBrunei DarussalamBulgariaBurkina FasoBurundiCabo VerdeCambodiaCameroonCanadaChadChileColombiaComorosCongo, Dem. Rep.Congo, Rep.Costa RicaCote d'IvoireCroatiaCubaCyprusCzech RepublicDenmarkDjiboutiDominican RepublicEcuadorEgypt, Arab Rep.El SalvadorEquatorial GuineaEritreaEstoniaFinlandFranceGabonGambia, TheGeorgiaGermanyGhanaGreeceGuatemalaGuineaHaitiHondurasHong Kong SAR, ChinaHungaryIcelandIndiaIndonesiaIran, Islamic Rep.IrelandIsraelItalyJamaicaJapanJordanKazakhstanKenyaKiribatiKorea, Rep.KosovoKuwaitKyrgyz RepublicLao PDRLatviaLebanonLiberiaLithuaniaLuxembourgMacao SAR, ChinaMacedonia, FYRMadagascarMalawiMalaysiaMaliMarshall IslandsMauritaniaMauritiusMexicoMoldovaMongoliaMontenegroMoroccoMozambiqueNamibiaNepalNetherlandsNew ZealandNicaraguaNigerNigeriaNorwayOmanPakistanPanamaPapua New GuineaParaguayPeruPhilippinesPolandPortugalPuerto RicoQatarRomaniaRussian FederationRwandaSaudi ArabiaSenegalSeychellesSierra LeoneSingaporeSlovak RepublicSloveniaSolomon IslandsSomaliaSouth AfricaSouth SudanSpainSri LankaSudanSurinameSwazilandSwedenSwitzerlandSyrian Arab RepublicTajikistanTanzaniaThailandTimor-LesteTogoTrinidad and TobagoTunisiaTurkeyTurkmenistanUgandaUkraineUnited Arab EmiratesUnited KingdomUnited StatesUruguayVanuatuVenezuela, RBVietnamWest Bank and GazaYemen, Rep.ZambiaZimbabwe Timeline:
This timeline shows a graph from 1990 to 2016 of Bahamas, The. No data until 1989. Number of actual observations by date: 26.
Source name:
World Development Indicators
Source organization:
World Bank national accounts data, and OECD National Accounts data files.
Categories, topics:
Economy & Growth
Last updated:
apr 23, 2017
Indicators value changes by year
Minimum:
-64.635 mln
jan 1, 1997
Maximum:
63.79 mln
jan 1, 1995
At the date of observation
Value
Absolute change
Change from previous value
jan 1, 1990
-31.112 mln
-31.112 mln
0.0%
jan 1, 1991
-13.974 mln
+17.138 mln
-55.09%
jan 1, 1992
-22.698 mln
-8.724 mln
62.43%
jan 1, 1993
-60.88 mln
-38.182 mln
168.22%
jan 1, 1994
29.154 mln
+90.034 mln
-147.89%
jan 1, 1995
63.79 mln
+34.636 mln
118.8%
jan 1, 1996
3.225 mln
-60.565 mln
-94.94%
jan 1, 1997
-64.635 mln
-67.86 mln
-2.1K%
jan 1, 1998
2.0K
+64.637 mln
-100.0%
jan 1, 1999
-7.0K
-9.0K
-450.0%
jan 1, 2000
2.0K
+9.0K
-128.57%
jan 1, 2001
-1000.0
-3.0K
-150.0%
jan 1, 2002
-1000.0
0.0
0.0%
jan 1, 2003
-3.0K
-2.0K
200.0%
jan 1, 2004
-2.0K
+1000.0
-33.33%
jan 1, 2005
5.0K
+7.0K
-350.0%
jan 1, 2006
7.0K
+2.0K
40.0%
jan 1, 2007
8.0K
+1000.0
14.29%
jan 1, 2008
-8.0K
-16.0K
-200.0%
jan 1, 2009
-61.0K
-53.0K
662.5%
jan 1, 2010
-5.0K
+56.0K
-91.8%
jan 1, 2011
0.0
+5.0K
-100.0%
Ranking of countries by current statistics by years


Comments: