29
/
en
AIzaSyAYiBZKx7MnpbEhh9jyipgxe19OcubqV5w
April 1, 2024
175176
Latvia
LVA
true
2
1
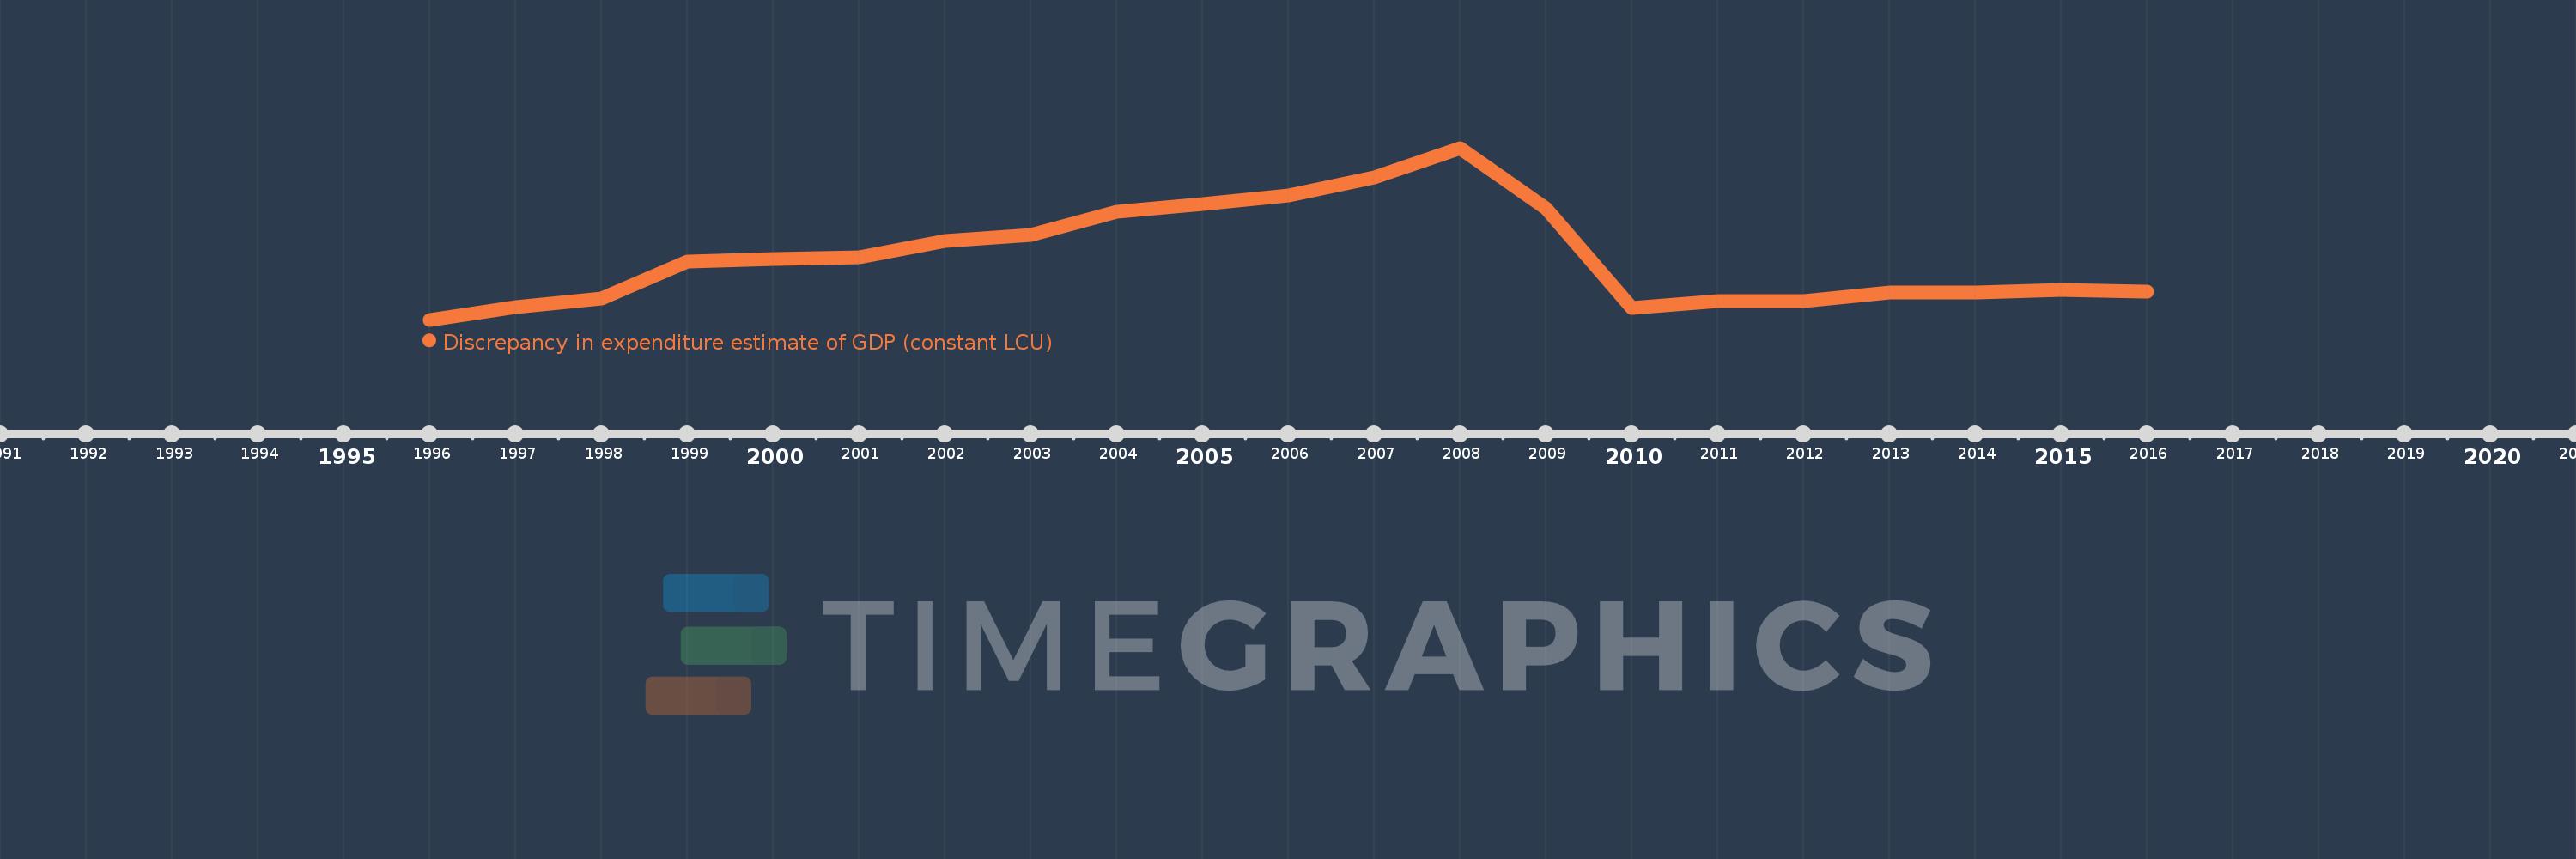
Discrepancy in expenditure estimate of GDP (constant LCU)
2016,2015,2014,2013,2012,2011,2010,2009,2008,2007,2006,2005,2004,2003,2002,2001,2000,1999,1998,1997,1996
This statistics in other country:
AlbaniaAlgeriaAngolaAntigua and BarbudaArgentinaArmeniaAustraliaAustriaAzerbaijanBahamas, TheBahrainBangladeshBarbadosBelarusBelgiumBelizeBeninBhutanBoliviaBosnia and HerzegovinaBotswanaBrazilBrunei DarussalamBulgariaBurkina FasoBurundiCabo VerdeCambodiaCameroonCanadaChadChileColombiaComorosCongo, Dem. Rep.Congo, Rep.Costa RicaCote d'IvoireCroatiaCubaCyprusCzech RepublicDenmarkDjiboutiDominican RepublicEcuadorEgypt, Arab Rep.El SalvadorEquatorial GuineaEritreaEstoniaFinlandFranceGabonGambia, TheGeorgiaGermanyGhanaGreeceGuatemalaGuineaHaitiHondurasHong Kong SAR, ChinaHungaryIcelandIndiaIndonesiaIran, Islamic Rep.IrelandIsraelItalyJamaicaJapanJordanKazakhstanKenyaKiribatiKorea, Rep.KosovoKuwaitKyrgyz RepublicLao PDRLatviaLebanonLiberiaLithuaniaLuxembourgMacao SAR, ChinaMacedonia, FYRMadagascarMalawiMalaysiaMaliMarshall IslandsMauritaniaMauritiusMexicoMoldovaMongoliaMontenegroMoroccoMozambiqueNamibiaNepalNetherlandsNew ZealandNicaraguaNigerNigeriaNorwayOmanPakistanPanamaPapua New GuineaParaguayPeruPhilippinesPolandPortugalPuerto RicoQatarRomaniaRussian FederationRwandaSaudi ArabiaSenegalSeychellesSierra LeoneSingaporeSlovak RepublicSloveniaSolomon IslandsSomaliaSouth AfricaSouth SudanSpainSri LankaSudanSurinameSwazilandSwedenSwitzerlandSyrian Arab RepublicTajikistanTanzaniaThailandTimor-LesteTogoTrinidad and TobagoTunisiaTurkeyTurkmenistanUgandaUkraineUnited Arab EmiratesUnited KingdomUnited StatesUruguayVanuatuVenezuela, RBVietnamWest Bank and GazaYemen, Rep.ZambiaZimbabwe Timeline:
This timeline shows a graph from 1996 to 2016 of Latvia. No data until 1995. Number of actual observations by date: 21.
Source name:
World Development Indicators
Source organization:
World Bank national accounts data, and OECD National Accounts data files.
Categories, topics:
Economy & Growth
Last updated:
apr 23, 2017
Indicators value changes by year
Minimum:
-79.613 mln
jan 1, 1996
Maximum:
646.535 mln
jan 1, 2008
At the date of observation
Value
Absolute change
Change from previous value
jan 1, 1996
-79.613 mln
-79.613 mln
0.0%
jan 1, 1997
-26.658 mln
+52.955 mln
-66.52%
jan 1, 1998
9.957 mln
+36.615 mln
-137.35%
jan 1, 1999
167.324 mln
+157.367 mln
1.58K%
jan 1, 2000
176.003 mln
+8.679 mln
5.19%
jan 1, 2001
185.907 mln
+9.904 mln
5.63%
jan 1, 2002
252.707 mln
+66.8 mln
35.93%
jan 1, 2003
278.32 mln
+25.613 mln
10.14%
jan 1, 2004
375.527 mln
+97.207 mln
34.93%
jan 1, 2005
410.653 mln
+35.126 mln
9.35%
jan 1, 2006
447.205 mln
+36.552 mln
8.9%
jan 1, 2007
522.362 mln
+75.157 mln
16.81%
jan 1, 2008
646.535 mln
+124.173 mln
23.77%
jan 1, 2009
392.695 mln
-253.84 mln
-39.26%
jan 1, 2010
-30.394 mln
-423.089 mln
-107.74%
jan 1, 2011
0.0
+30.394 mln
-100.0%
jan 1, 2013
34.465 mln
+34.465 mln
%
jan 1, 2014
35.029 mln
+564.0K
1.64%
jan 1, 2015
45.389 mln
+10.36 mln
29.58%
jan 1, 2016
40.748 mln
-4.641 mln
-10.22%
Ranking of countries by current statistics by years


Comments: