29
/
en
AIzaSyAYiBZKx7MnpbEhh9jyipgxe19OcubqV5w
April 1, 2024
259436
Tajikistan
TJK
true
2
1
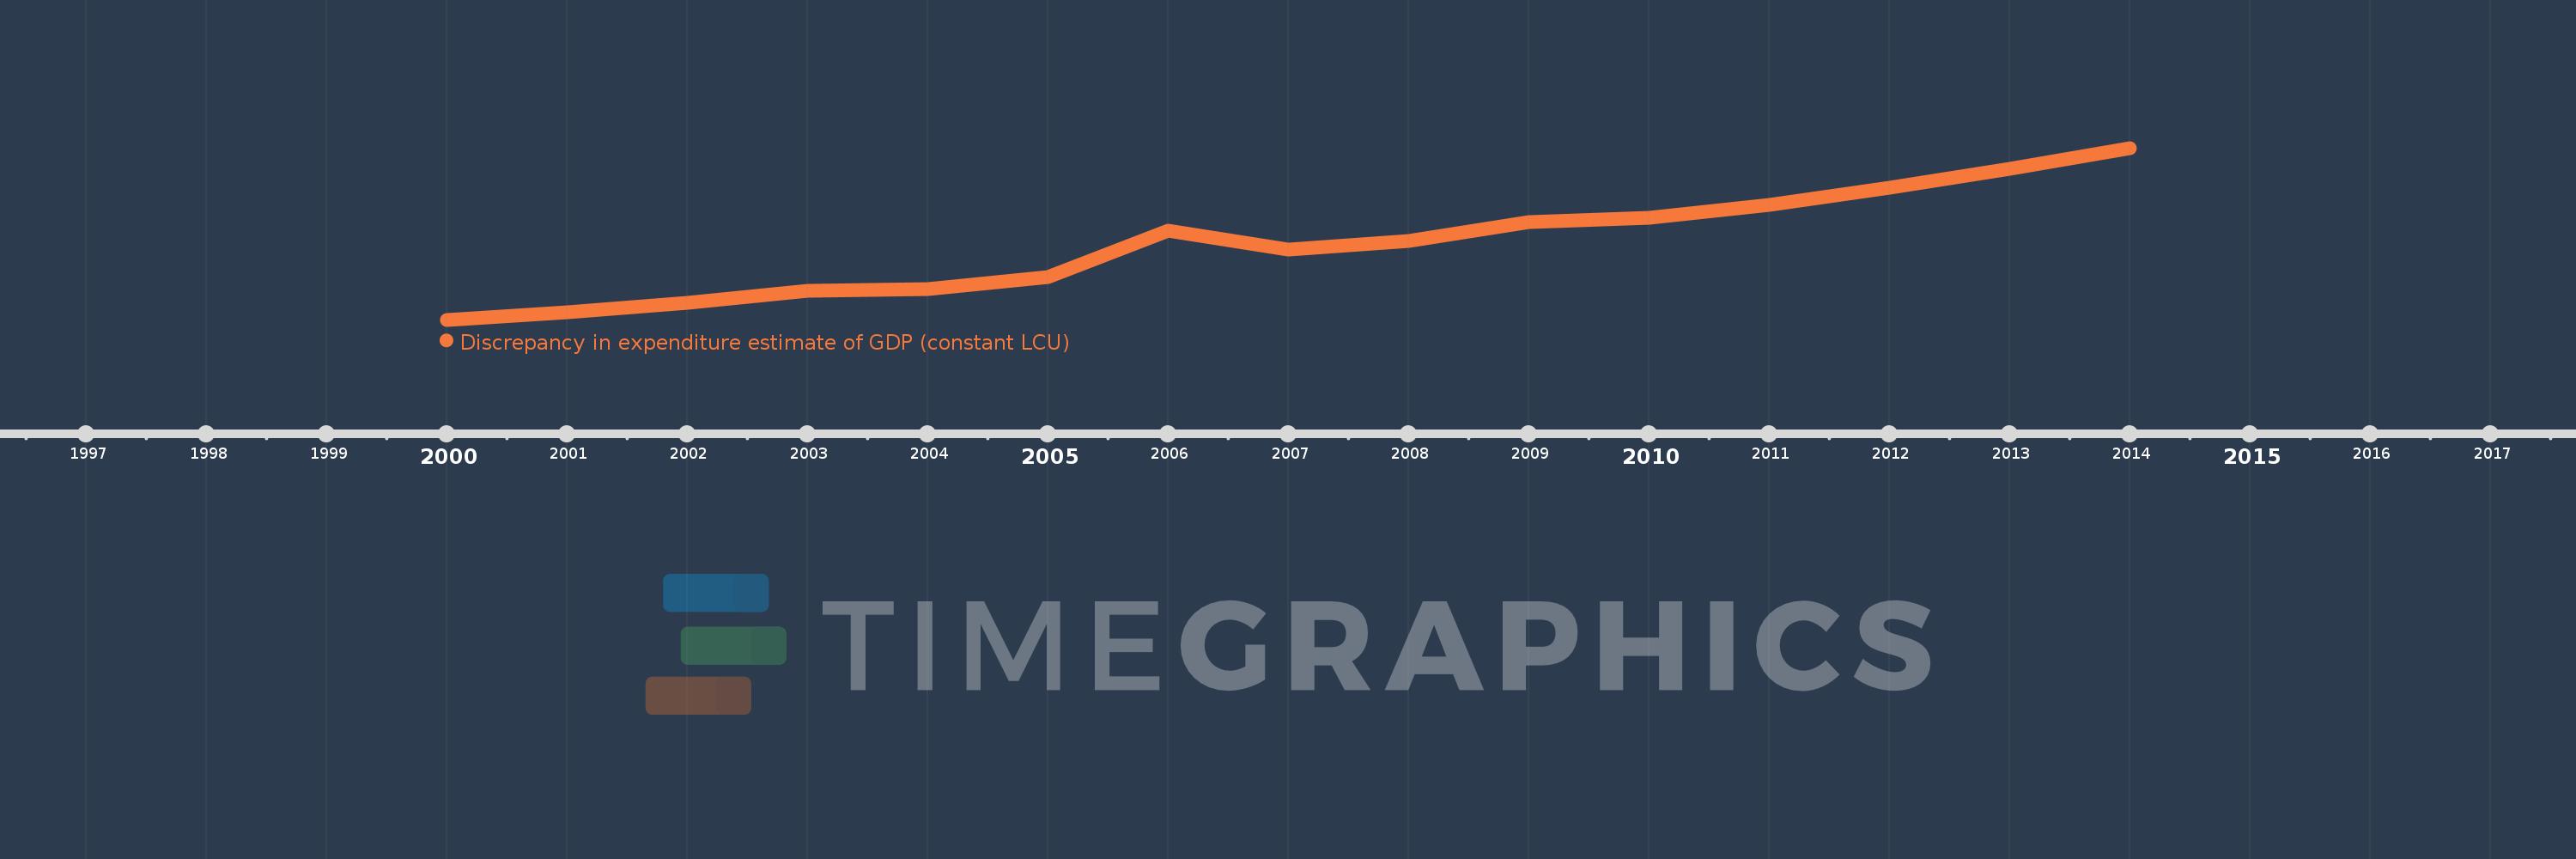
Discrepancy in expenditure estimate of GDP (constant LCU)
2014,2013,2012,2011,2010,2009,2008,2007,2006,2005,2004,2003,2002,2001,2000
This statistics in other country:
AlbaniaAlgeriaAngolaAntigua and BarbudaArgentinaArmeniaAustraliaAustriaAzerbaijanBahamas, TheBahrainBangladeshBarbadosBelarusBelgiumBelizeBeninBhutanBoliviaBosnia and HerzegovinaBotswanaBrazilBrunei DarussalamBulgariaBurkina FasoBurundiCabo VerdeCambodiaCameroonCanadaChadChileColombiaComorosCongo, Dem. Rep.Congo, Rep.Costa RicaCote d'IvoireCroatiaCubaCyprusCzech RepublicDenmarkDjiboutiDominican RepublicEcuadorEgypt, Arab Rep.El SalvadorEquatorial GuineaEritreaEstoniaFinlandFranceGabonGambia, TheGeorgiaGermanyGhanaGreeceGuatemalaGuineaHaitiHondurasHong Kong SAR, ChinaHungaryIcelandIndiaIndonesiaIran, Islamic Rep.IrelandIsraelItalyJamaicaJapanJordanKazakhstanKenyaKiribatiKorea, Rep.KosovoKuwaitKyrgyz RepublicLao PDRLatviaLebanonLiberiaLithuaniaLuxembourgMacao SAR, ChinaMacedonia, FYRMadagascarMalawiMalaysiaMaliMarshall IslandsMauritaniaMauritiusMexicoMoldovaMongoliaMontenegroMoroccoMozambiqueNamibiaNepalNetherlandsNew ZealandNicaraguaNigerNigeriaNorwayOmanPakistanPanamaPapua New GuineaParaguayPeruPhilippinesPolandPortugalPuerto RicoQatarRomaniaRussian FederationRwandaSaudi ArabiaSenegalSeychellesSierra LeoneSingaporeSlovak RepublicSloveniaSolomon IslandsSomaliaSouth AfricaSouth SudanSpainSri LankaSudanSurinameSwazilandSwedenSwitzerlandSyrian Arab RepublicTajikistanTanzaniaThailandTimor-LesteTogoTrinidad and TobagoTunisiaTurkeyTurkmenistanUgandaUkraineUnited Arab EmiratesUnited KingdomUnited StatesUruguayVanuatuVenezuela, RBVietnamWest Bank and GazaYemen, Rep.ZambiaZimbabwe Timeline:
This timeline shows a graph from 2000 to 2014 of Tajikistan. No data until 1999. Number of actual observations by date: 15.
Source name:
World Development Indicators
Source organization:
World Bank national accounts data, and OECD National Accounts data files.
Categories, topics:
Economy & Growth
Last updated:
apr 23, 2017
Indicators value changes by year
Minimum:
-179.161 mln
jan 1, 2000
Maximum:
1.803 bln
jan 1, 2014
At the date of observation
Value
Absolute change
Change from previous value
jan 1, 2000
-179.161 mln
-179.161 mln
0.0%
jan 1, 2001
-89.108 mln
+90.053 mln
-50.26%
jan 1, 2002
14.986 mln
+104.095 mln
-116.82%
jan 1, 2003
151.089 mln
+136.103 mln
908.17%
jan 1, 2004
177.002 mln
+25.913 mln
17.15%
jan 1, 2005
316.14 mln
+139.138 mln
78.61%
jan 1, 2006
845.619 mln
+529.479 mln
167.48%
jan 1, 2007
629.642 mln
-215.977 mln
-25.54%
jan 1, 2008
726.423 mln
+96.781 mln
15.37%
jan 1, 2009
945.269 mln
+218.846 mln
30.13%
jan 1, 2010
1.002 bln
+56.438 mln
5.97%
jan 1, 2011
1.146 bln
+144.496 mln
14.42%
jan 1, 2012
1.342 bln
+195.343 mln
17.04%
jan 1, 2013
1.563 bln
+221.027 mln
16.48%
jan 1, 2014
1.803 bln
+240.189 mln
15.37%
Ranking of countries by current statistics by years


Comments: