29
/
en
AIzaSyAYiBZKx7MnpbEhh9jyipgxe19OcubqV5w
April 1, 2024
75588
Azerbaijan
AZE
true
2
1
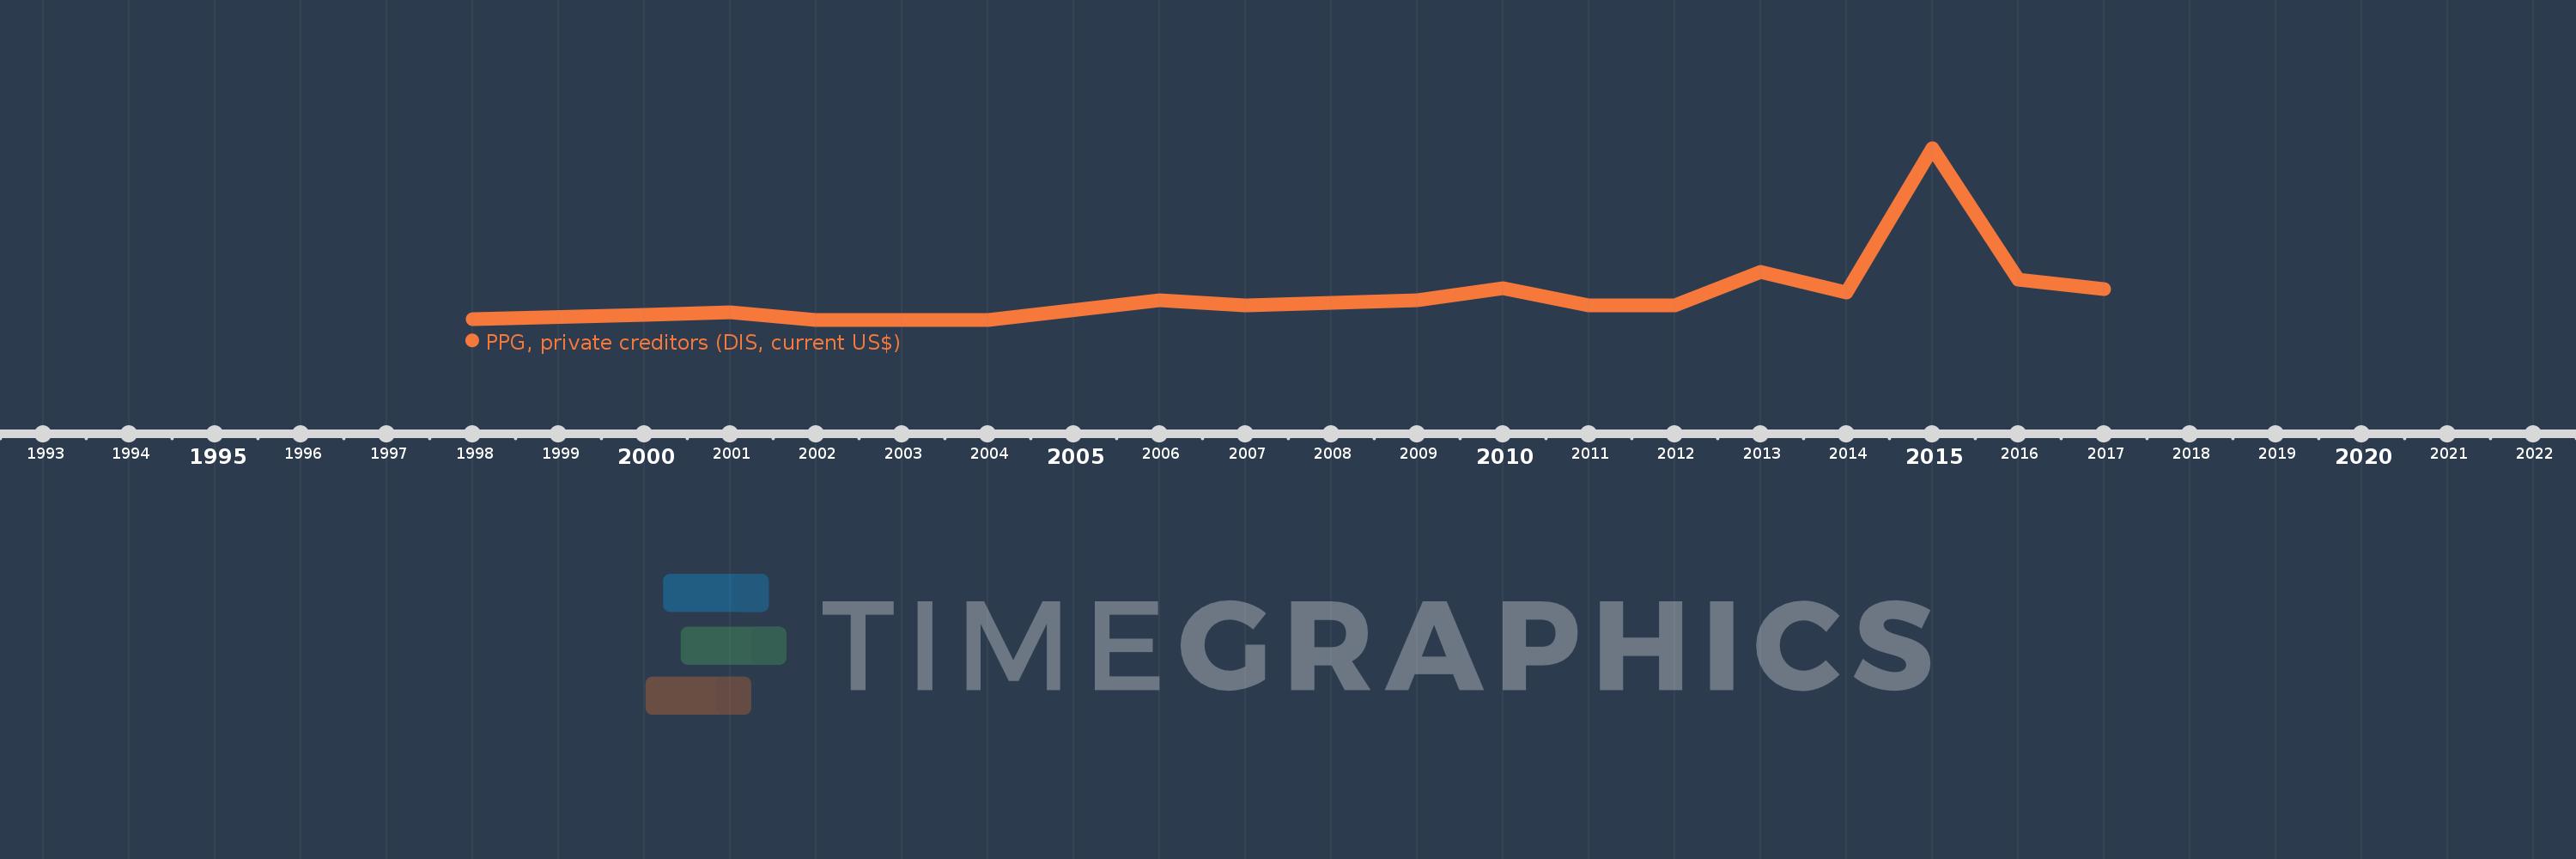
PPG, private creditors (DIS, current US$)
2017,2016,2015,2014,2013,2012,2011,2010,2009,2008,2007,2006,2004,2003,2002,2001,2000,1998
This statistics in other country:
Timeline:
This timeline shows a graph from 1998 to 2017 of Azerbaijan. No data until 1997. Number of actual observations by date: 18.
Source name:
World Development Indicators
Source organization:
World Bank, International Debt Statistics.
Categories, topics:
External Debt
Last updated:
apr 23, 2017
Indicators value changes by year
Maximum:
2.108 bln
jan 1, 2015
At the date of observation
Value
Absolute change
Change from previous value
jan 1, 1998
8.057 mln
+8.057 mln
0.0%
jan 1, 2000
55.058 mln
+47.001 mln
583.36%
jan 1, 2001
87.789 mln
+32.731 mln
59.45%
jan 1, 2002
515.0K
-87.274 mln
-99.41%
jan 1, 2003
47.0K
-468.0K
-90.87%
jan 1, 2004
0.0
-47.0K
-100.0%
jan 1, 2006
235.648 mln
+235.648 mln
%
jan 1, 2007
177.081 mln
-58.567 mln
-24.85%
jan 1, 2008
209.717 mln
+32.636 mln
18.43%
jan 1, 2009
242.143 mln
+32.426 mln
15.46%
jan 1, 2010
388.575 mln
+146.432 mln
60.47%
jan 1, 2011
180.45 mln
-208.125 mln
-53.56%
jan 1, 2012
180.078 mln
-372.0K
-0.21%
jan 1, 2013
590.361 mln
+410.283 mln
227.84%
jan 1, 2014
332.754 mln
-257.607 mln
-43.64%
jan 1, 2015
2.108 bln
+1.776 bln
533.64%
jan 1, 2016
497.306 mln
-1.611 bln
-76.41%
jan 1, 2017
375.557 mln
-121.749 mln
-24.48%
Ranking of countries by current statistics by years


Comments: