29
/
en
AIzaSyAYiBZKx7MnpbEhh9jyipgxe19OcubqV5w
April 1, 2024
252378
St. Vincent and the Grenadines
VCT
true
2
1
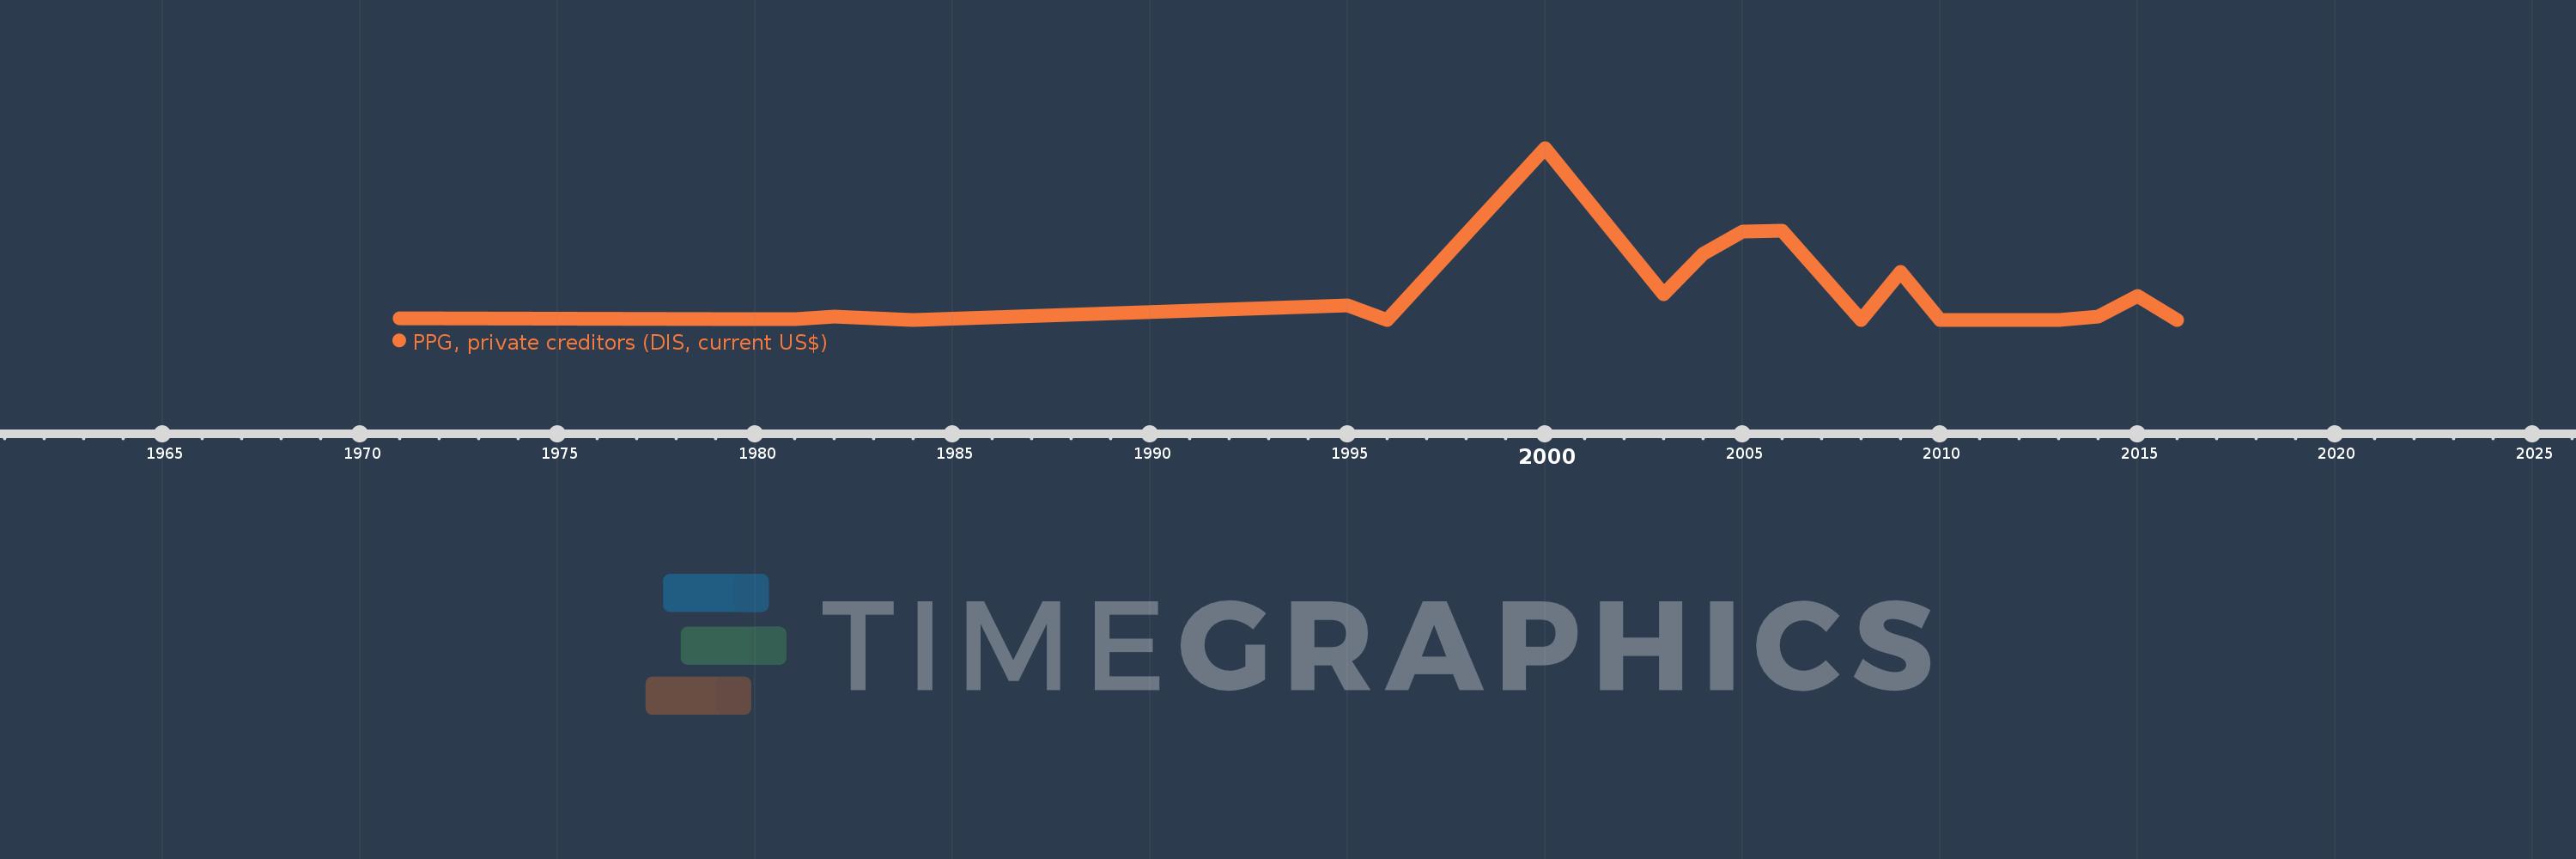
PPG, private creditors (DIS, current US$)
2016,2015,2014,2013,2012,2011,2010,2009,2008,2006,2005,2004,2003,2000,1996,1995,1984,1982,1981,1980,1971
This statistics in other country:
Timeline:
This timeline shows a graph from 1971 to 2016 of St. Vincent and the Grenadines. No data until 1970. Number of actual observations by date: 21.
Source name:
World Development Indicators
Source organization:
World Bank, International Debt Statistics.
Categories, topics:
External Debt
Last updated:
apr 23, 2017
Indicators value changes by year
Maximum:
57.882 mln
jan 1, 2000
At the date of observation
Value
Absolute change
Change from previous value
jan 1, 1971
360.0K
+360.0K
0.0%
jan 1, 1980
223.0K
-137.0K
-38.06%
jan 1, 1981
135.0K
-88.0K
-39.46%
jan 1, 1982
1.026 mln
+891.0K
660.0%
jan 1, 1984
19.0K
-1.007 mln
-98.15%
jan 1, 1995
4.749 mln
+4.73 mln
24.89K%
jan 1, 1996
51.0K
-4.698 mln
-98.93%
jan 1, 2000
57.882 mln
+57.831 mln
113.39K%
jan 1, 2003
8.58 mln
-49.302 mln
-85.18%
jan 1, 2004
22.222 mln
+13.642 mln
159.0%
jan 1, 2005
29.815 mln
+7.593 mln
34.17%
jan 1, 2006
30.0 mln
+185.0K
0.62%
jan 1, 2008
0.0
-30.0 mln
-100.0%
jan 1, 2009
16.0 mln
+16.0 mln
%
jan 1, 2010
0.0
-16.0 mln
-100.0%
jan 1, 2014
970.0K
+970.0K
%
jan 1, 2015
7.962 mln
+6.992 mln
720.82%
jan 1, 2016
0.0
-7.962 mln
-100.0%
Ranking of countries by current statistics by years


Comments: