29
/
en
AIzaSyAYiBZKx7MnpbEhh9jyipgxe19OcubqV5w
April 1, 2024
184447
Macedonia, FYR
MKD
true
2
1
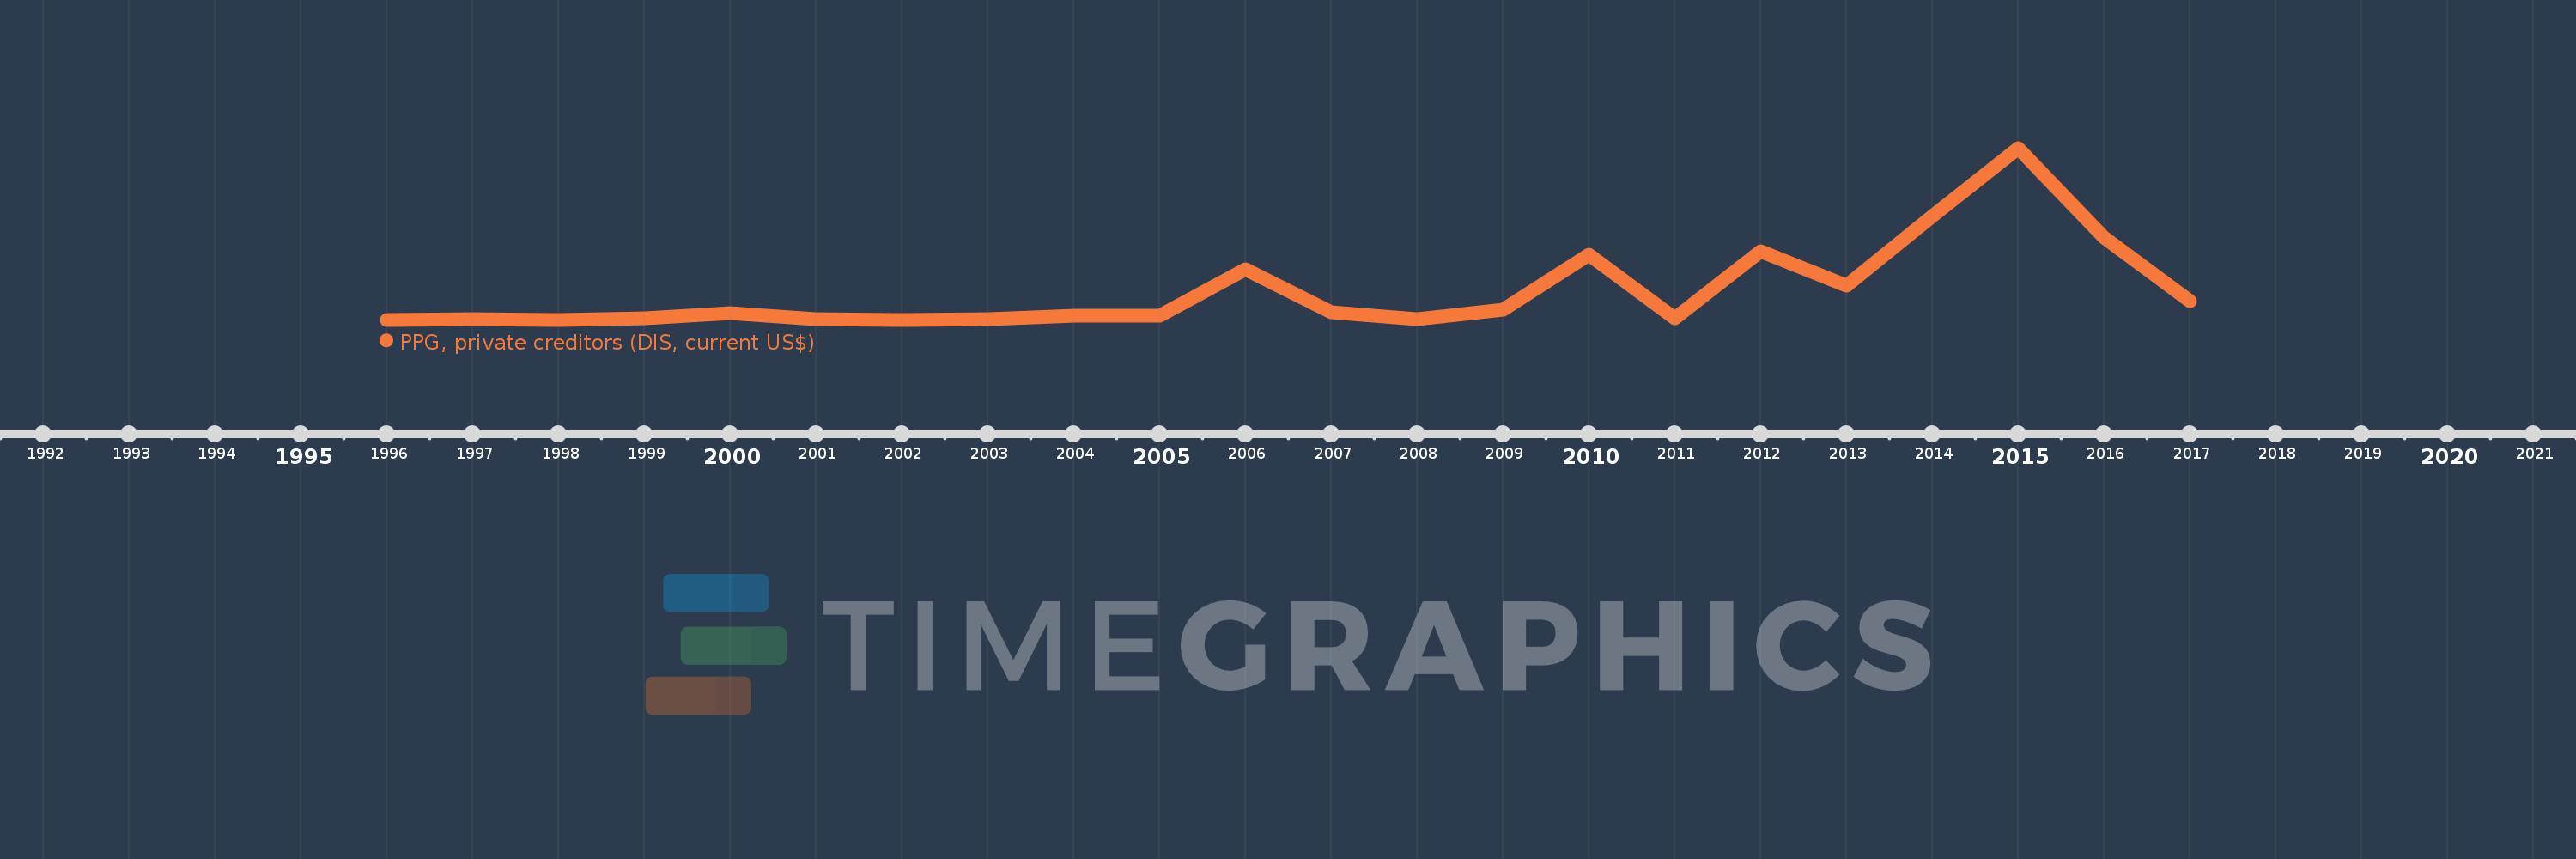
PPG, private creditors (DIS, current US$)
2017,2016,2015,2014,2013,2012,2011,2010,2009,2008,2007,2006,2005,2004,2003,2002,2001,2000,1999,1998,1997,1996
This statistics in other country:
Timeline:
This timeline shows a graph from 1996 to 2017 of Macedonia, FYR. No data until 1995. Number of actual observations by date: 22.
Source name:
World Development Indicators
Source organization:
World Bank, International Debt Statistics.
Categories, topics:
External Debt
Last updated:
apr 23, 2017
Indicators value changes by year
Minimum:
184.0K
jan 1, 1998
Maximum:
647.093 mln
jan 1, 2015
At the date of observation
Value
Absolute change
Change from previous value
jan 1, 1996
380.0K
+380.0K
0.0%
jan 1, 1997
1.171 mln
+791.0K
208.16%
jan 1, 1998
184.0K
-987.0K
-84.29%
jan 1, 1999
5.592 mln
+5.408 mln
2.94K%
jan 1, 2000
24.909 mln
+19.317 mln
345.44%
jan 1, 2001
1.385 mln
-23.524 mln
-94.44%
jan 1, 2002
619.0K
-766.0K
-55.31%
jan 1, 2003
2.768 mln
+2.149 mln
347.17%
jan 1, 2004
15.542 mln
+12.774 mln
461.49%
jan 1, 2005
15.302 mln
-240.0K
-1.54%
jan 1, 2006
188.777 mln
+173.475 mln
1.13K%
jan 1, 2007
28.649 mln
-160.128 mln
-84.82%
jan 1, 2008
3.311 mln
-25.338 mln
-88.44%
jan 1, 2009
36.954 mln
+33.643 mln
1.02K%
jan 1, 2010
244.025 mln
+207.071 mln
560.35%
jan 1, 2011
6.535 mln
-237.49 mln
-97.32%
jan 1, 2012
258.965 mln
+252.43 mln
3.86K%
jan 1, 2013
127.483 mln
-131.482 mln
-50.77%
jan 1, 2014
389.025 mln
+261.542 mln
205.16%
jan 1, 2015
647.093 mln
+258.068 mln
66.34%
jan 1, 2016
311.238 mln
-335.855 mln
-51.9%
jan 1, 2017
70.933 mln
-240.305 mln
-77.21%
Ranking of countries by current statistics by years


Comments: