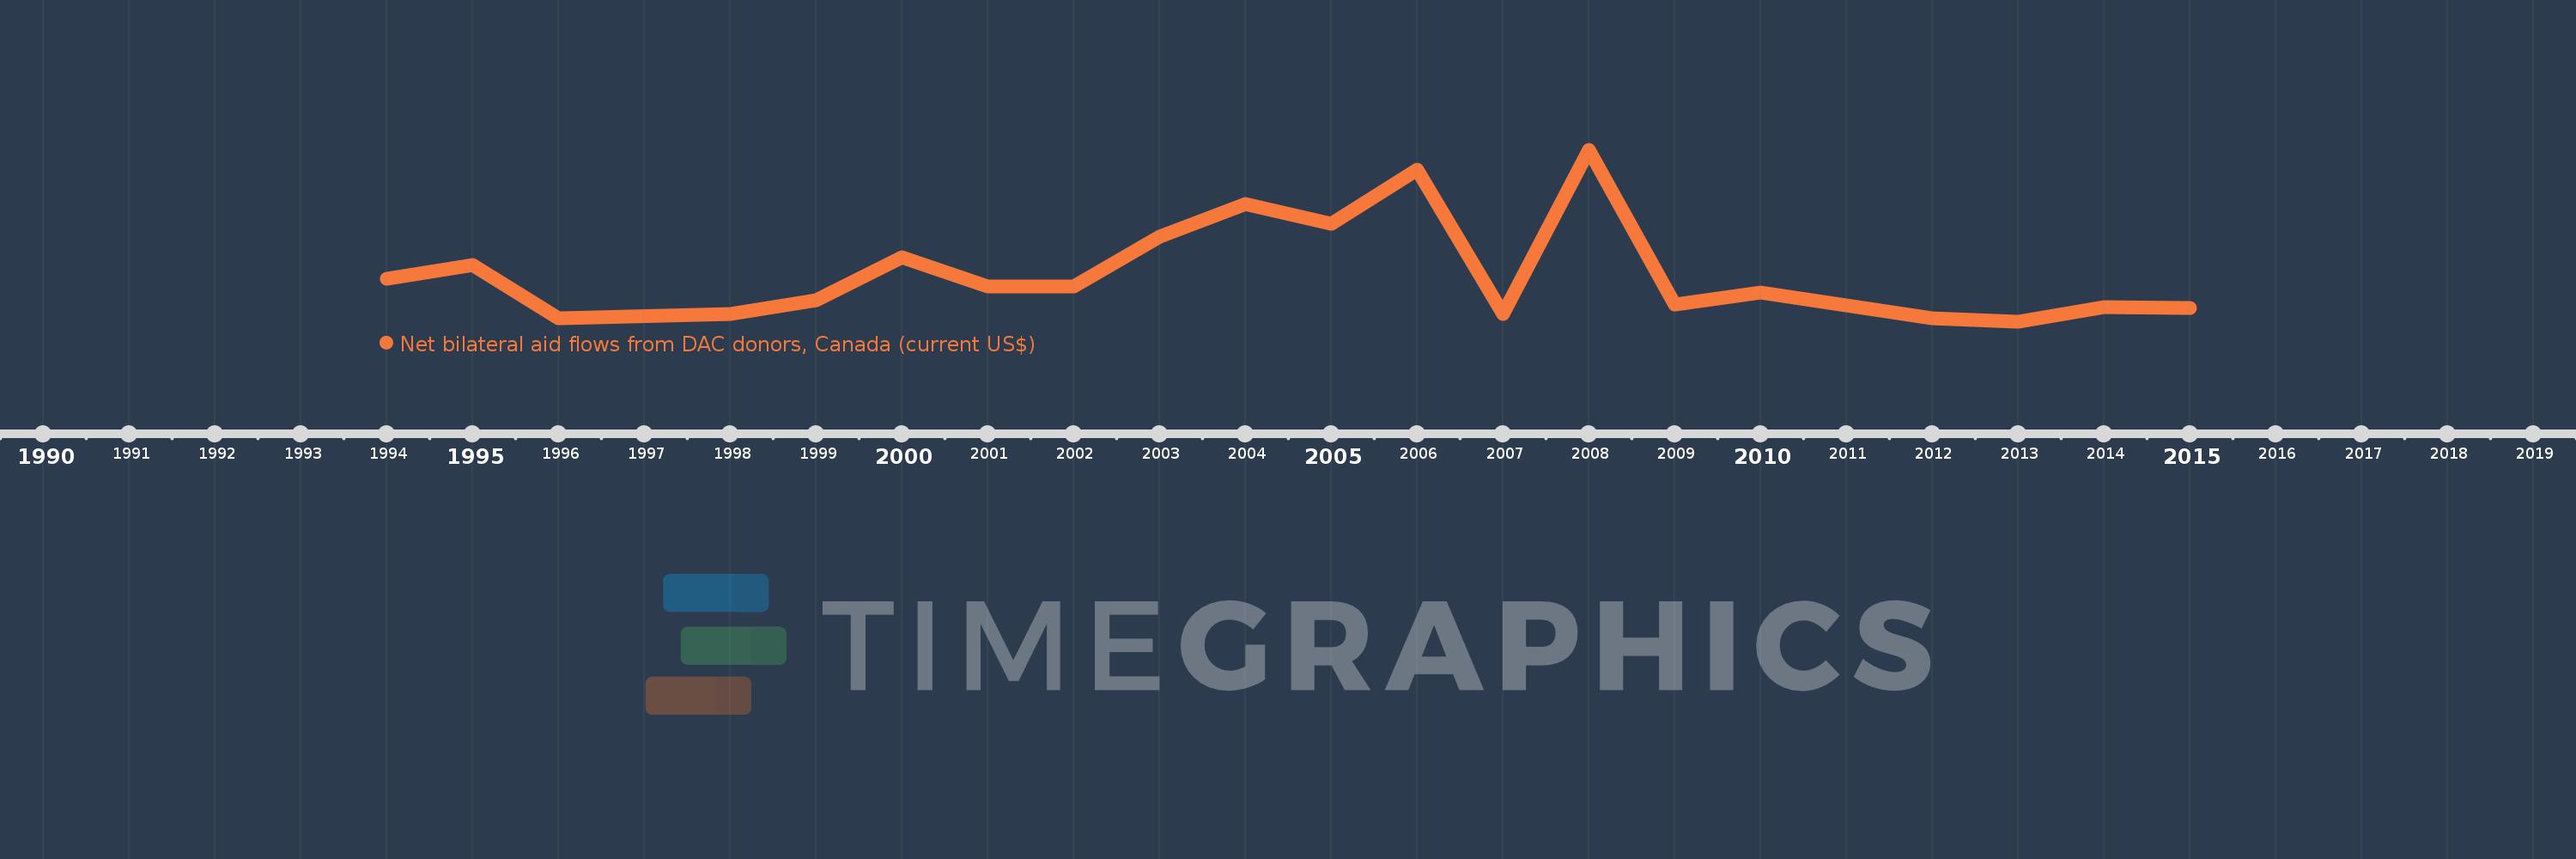
This timeline shows a graph from 1994 to 2015 of Azerbaijan. No data until 1993. Number of actual observations by date: 20.
Source name:
World Development Indicators
Source organization:
Development Assistance Committee of the Organisation for Economic Co-operation and Development, Geographical Distribution of Financial Flows to Developing Countries, Development Co-operation Report, and International Development Statistics database. Data are available online at: www.oecd.org/dac/stats/idsonline.
Categories, topics:
Aid Effectiveness
Last updated:
apr 23, 2017
Indicators value changes by year
Meaning:
441.0K
Minimum:
10.0K
jan 1, 2013
Maximum:
1.52 mln
jan 1, 2008
At the date of observation
Value
Absolute change
Change from the previous value
jan 1, 1994
390.0K
+390.0K
0.0%
jan 1, 1995
510.0K
+120.0K
30.77%
jan 1, 1996
40.0K
-470.0K
-92.16%
jan 1, 1998
80.0K
+40.0K
100.0%
jan 1, 1999
200.0K
+120.0K
150.0%
jan 1, 2000
580.0K
+380.0K
190.0%
jan 1, 2001
320.0K
-260.0K
-44.83%
jan 1, 2002
320.0K
0.0
0.0%
jan 1, 2003
760.0K
+440.0K
137.5%
jan 1, 2004
1.05 mln
+290.0K
38.16%
jan 1, 2005
870.0K
-180.0K
-17.14%
jan 1, 2006
1.35 mln
+480.0K
55.17%
jan 1, 2007
80.0K
-1.27 mln
-94.07%
jan 1, 2008
1.52 mln
+1.44 mln
1.8K%
jan 1, 2009
160.0K
-1.36 mln
-89.47%
jan 1, 2010
270.0K
+110.0K
68.75%
jan 1, 2012
40.0K
-230.0K
-85.19%
jan 1, 2013
10.0K
-30.0K
-75.0%
jan 1, 2014
140.0K
+130.0K
1.3K%
jan 1, 2015
130.0K
-10.0K
-7.14%
Ranking of countries by current statistics by years
