29
/
en
AIzaSyAYiBZKx7MnpbEhh9jyipgxe19OcubqV5w
April 1, 2024
45346
Low & middle income
LMY
false
2
1
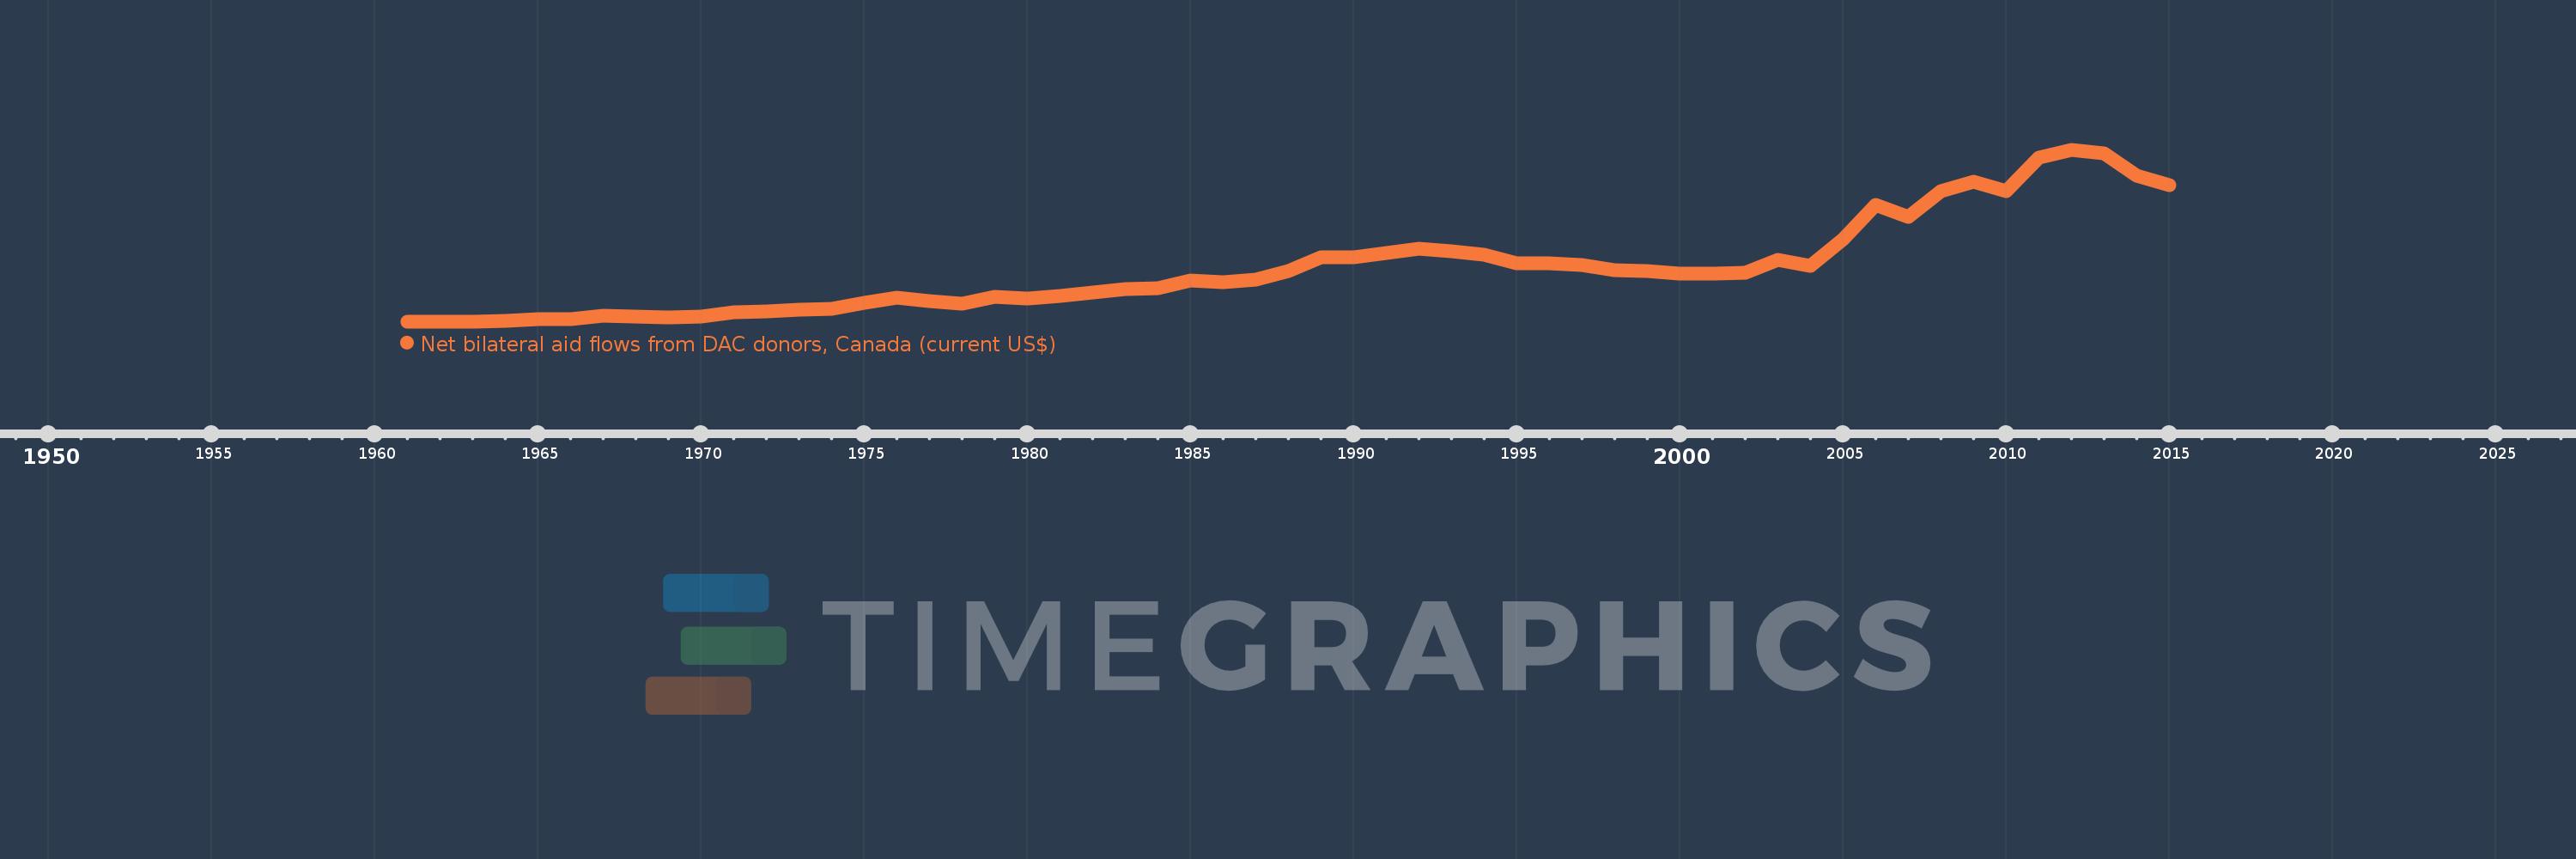
Net bilateral aid flows from DAC donors, Canada (current US$)
2015,2014,2013,2012,2011,2010,2009,2008,2007,2006,2005,2004,2003,2002,2001,2000,1999,1998,1997,1996,1995,1994,1993,1992,1991,1990,1989,1988,1987,1986,1985,1984,1983,1982,1981,1980,1979,1978,1977,1976,1975,1974,1973,1972,1971,1970,1969,1968,1967,1966,1965,1964,1963,1962,1961
This statistics in other country:
AfghanistanAlbaniaAlgeriaAngolaAntigua and BarbudaArab WorldArgentinaArmeniaAzerbaijanBahamas, TheBangladeshBarbadosBelarusBelizeBeninBermudaBhutanBoliviaBosnia and HerzegovinaBotswanaBrazilBritish Virgin IslandsBrunei DarussalamBulgariaBurkina FasoBurundiCabo VerdeCambodiaCameroonCaribbean small statesCayman IslandsCentral African RepublicCentral Europe and the BalticsChadChileChinaColombiaComorosCongo, Dem. Rep.Congo, Rep.Costa RicaCote d'IvoireCroatiaCubaCyprusCzech RepublicDjiboutiDominicaDominican RepublicEast Asia & PacificEast Asia & Pacific (excluding high income)East Asia & Pacific (IDA & IBRD countries)EcuadorEgypt, Arab Rep.El SalvadorEquatorial GuineaEritreaEstoniaEthiopiaEuro areaEurope & Central AsiaEurope & Central Asia (excluding high income)Europe & Central Asia (IDA & IBRD countries)European UnionFijiFragile and conflict affected situationsGabonGambia, TheGeorgiaGhanaGrenadaGuatemalaGuineaGuinea-BissauGuyanaHaitiHeavily indebted poor countries (HIPC)High incomeHondurasHong Kong SAR, ChinaHungaryIBRD onlyIDA & IBRD totalIDA blendIDA onlyIDA totalIndiaIndonesiaIran, Islamic Rep.IraqIsraelJamaicaJordanKazakhstanKenyaKiribatiKorea, Dem. People’s Rep.Korea, Rep.KosovoKyrgyz RepublicLao PDRLatin America & Caribbean Latin America & Caribbean (excluding high income)Latin America & the Caribbean (IDA & IBRD countries)LatviaLeast developed countries: UN classificationLebanonLesothoLiberiaLibyaLithuaniaLow & middle incomeLow incomeLower middle incomeMacedonia, FYRMadagascarMalawiMalaysiaMaldivesMaliMaltaMarshall IslandsMauritaniaMauritiusMexicoMicronesia, Fed. Sts.Middle East & North AfricaMiddle East & North Africa (excluding high income)Middle East & North Africa (IDA & IBRD countries)Middle incomeMoldovaMongoliaMontenegroMoroccoMozambiqueMyanmarNamibiaNauruNepalNew CaledoniaNicaraguaNigerNigeriaNorth AmericaNorthern Mariana IslandsOECD membersOther small statesPacific island small statesPakistanPalauPanamaPapua New GuineaParaguayPeruPhilippinesPolandRomaniaRussian FederationRwandaSamoaSao Tome and PrincipeSaudi ArabiaSenegalSerbiaSeychellesSierra LeoneSingaporeSlovak RepublicSloveniaSmall statesSolomon IslandsSomaliaSouth AfricaSouth AsiaSouth Asia (IDA & IBRD)South SudanSri LankaSt. Kitts and NevisSt. LuciaSt. Vincent and the GrenadinesSub-Saharan Africa Sub-Saharan Africa (excluding high income)Sub-Saharan Africa (IDA & IBRD countries)SudanSurinameSwazilandSyrian Arab RepublicTajikistanTanzaniaThailandTimor-LesteTogoTongaTrinidad and TobagoTunisiaTurkeyTurkmenistanTurks and Caicos IslandsTuvaluUgandaUkraineUpper middle incomeUruguayUzbekistanVanuatuVenezuela, RBVietnamWest Bank and GazaWorldYemen, Rep.ZambiaZimbabwe Timeline:
This timeline shows a graph from 1961 to 2015 of Low & middle income. No data until 1960. Number of actual observations by date: 55.
Source name:
World Development Indicators
Source organization:
Development Assistance Committee of the Organisation for Economic Co-operation and Development, Geographical Distribution of Financial Flows to Developing Countries, Development Co-operation Report, and International Development Statistics database. Data are available online at: www.oecd.org/dac/stats/idsonline.
Categories, topics:
Aid Effectiveness
Last updated:
apr 23, 2017
Indicators value changes by year
Minimum:
35.36 mln
jan 1, 1963
Maximum:
4.104 bln
jan 1, 2012
At the date of observation
Value
Absolute change
Change from previous value
jan 1, 1961
46.4 mln
+46.4 mln
0.0%
jan 1, 1962
43.98 mln
-2.42 mln
-5.22%
jan 1, 1963
35.36 mln
-8.62 mln
-19.6%
jan 1, 1964
71.38 mln
+36.02 mln
101.87%
jan 1, 1965
105.78 mln
+34.4 mln
48.19%
jan 1, 1966
95.63 mln
-10.15 mln
-9.6%
jan 1, 1967
176.53 mln
+80.9 mln
84.6%
jan 1, 1968
162.17 mln
-14.36 mln
-8.13%
jan 1, 1969
138.99 mln
-23.18 mln
-14.29%
jan 1, 1970
157.2 mln
+18.21 mln
13.1%
jan 1, 1971
259.01 mln
+101.81 mln
64.76%
jan 1, 1972
290.41 mln
+31.4 mln
12.12%
jan 1, 1973
333.79 mln
+43.38 mln
14.94%
jan 1, 1974
344.28 mln
+10.49 mln
3.14%
jan 1, 1975
492.06 mln
+147.78 mln
42.92%
jan 1, 1976
608.93 mln
+116.87 mln
23.75%
jan 1, 1977
523.45 mln
-85.48 mln
-14.04%
jan 1, 1978
470.81 mln
-52.64 mln
-10.06%
jan 1, 1979
640.53 mln
+169.72 mln
36.05%
jan 1, 1980
589.42 mln
-51.11 mln
-7.98%
jan 1, 1981
654.68 mln
+65.26 mln
11.07%
jan 1, 1982
736.37 mln
+81.69 mln
12.48%
jan 1, 1983
818.67 mln
+82.3 mln
11.18%
jan 1, 1984
838.46 mln
+19.79 mln
2.42%
jan 1, 1985
1.018 bln
+179.62 mln
21.42%
jan 1, 1986
983.75 mln
-34.33 mln
-3.37%
jan 1, 1987
1.047 bln
+63.22 mln
6.43%
jan 1, 1988
1.245 bln
+197.89 mln
18.9%
jan 1, 1989
1.566 bln
+321.31 mln
25.81%
jan 1, 1990
1.562 bln
-4.52 mln
-0.29%
jan 1, 1991
1.674 bln
+112.4 mln
7.2%
jan 1, 1992
1.766 bln
+91.52 mln
5.47%
jan 1, 1993
1.702 bln
-63.28 mln
-3.58%
jan 1, 1994
1.634 bln
-68.63 mln
-4.03%
jan 1, 1995
1.432 bln
-201.57 mln
-12.34%
jan 1, 1996
1.42 bln
-12.25 mln
-0.86%
jan 1, 1997
1.375 bln
-45.13 mln
-3.18%
jan 1, 1998
1.272 bln
-102.84 mln
-7.48%
jan 1, 1999
1.234 bln
-37.84 mln
-2.98%
jan 1, 2000
1.187 bln
-47.1 mln
-3.82%
jan 1, 2001
1.178 bln
-9.28 mln
-0.78%
jan 1, 2002
1.211 bln
+33.17 mln
2.82%
jan 1, 2003
1.509 bln
+298.5 mln
24.65%
jan 1, 2004
1.355 bln
-154.04 mln
-10.21%
jan 1, 2005
2.004 bln
+648.49 mln
47.85%
jan 1, 2006
2.81 bln
+806.39 mln
40.24%
jan 1, 2007
2.526 bln
-283.74 mln
-10.1%
jan 1, 2008
3.124 bln
+597.47 mln
23.65%
jan 1, 2009
3.359 bln
+234.94 mln
7.52%
jan 1, 2010
3.125 bln
-233.95 mln
-6.97%
jan 1, 2011
3.921 bln
+795.89 mln
25.47%
jan 1, 2012
4.104 bln
+183.58 mln
4.68%
jan 1, 2013
4.023 bln
-81.42 mln
-1.98%
jan 1, 2014
3.505 bln
-517.47 mln
-12.86%
jan 1, 2015
3.276 bln
-229.89 mln
-6.56%
Ranking of countries by current statistics by years


Comments: