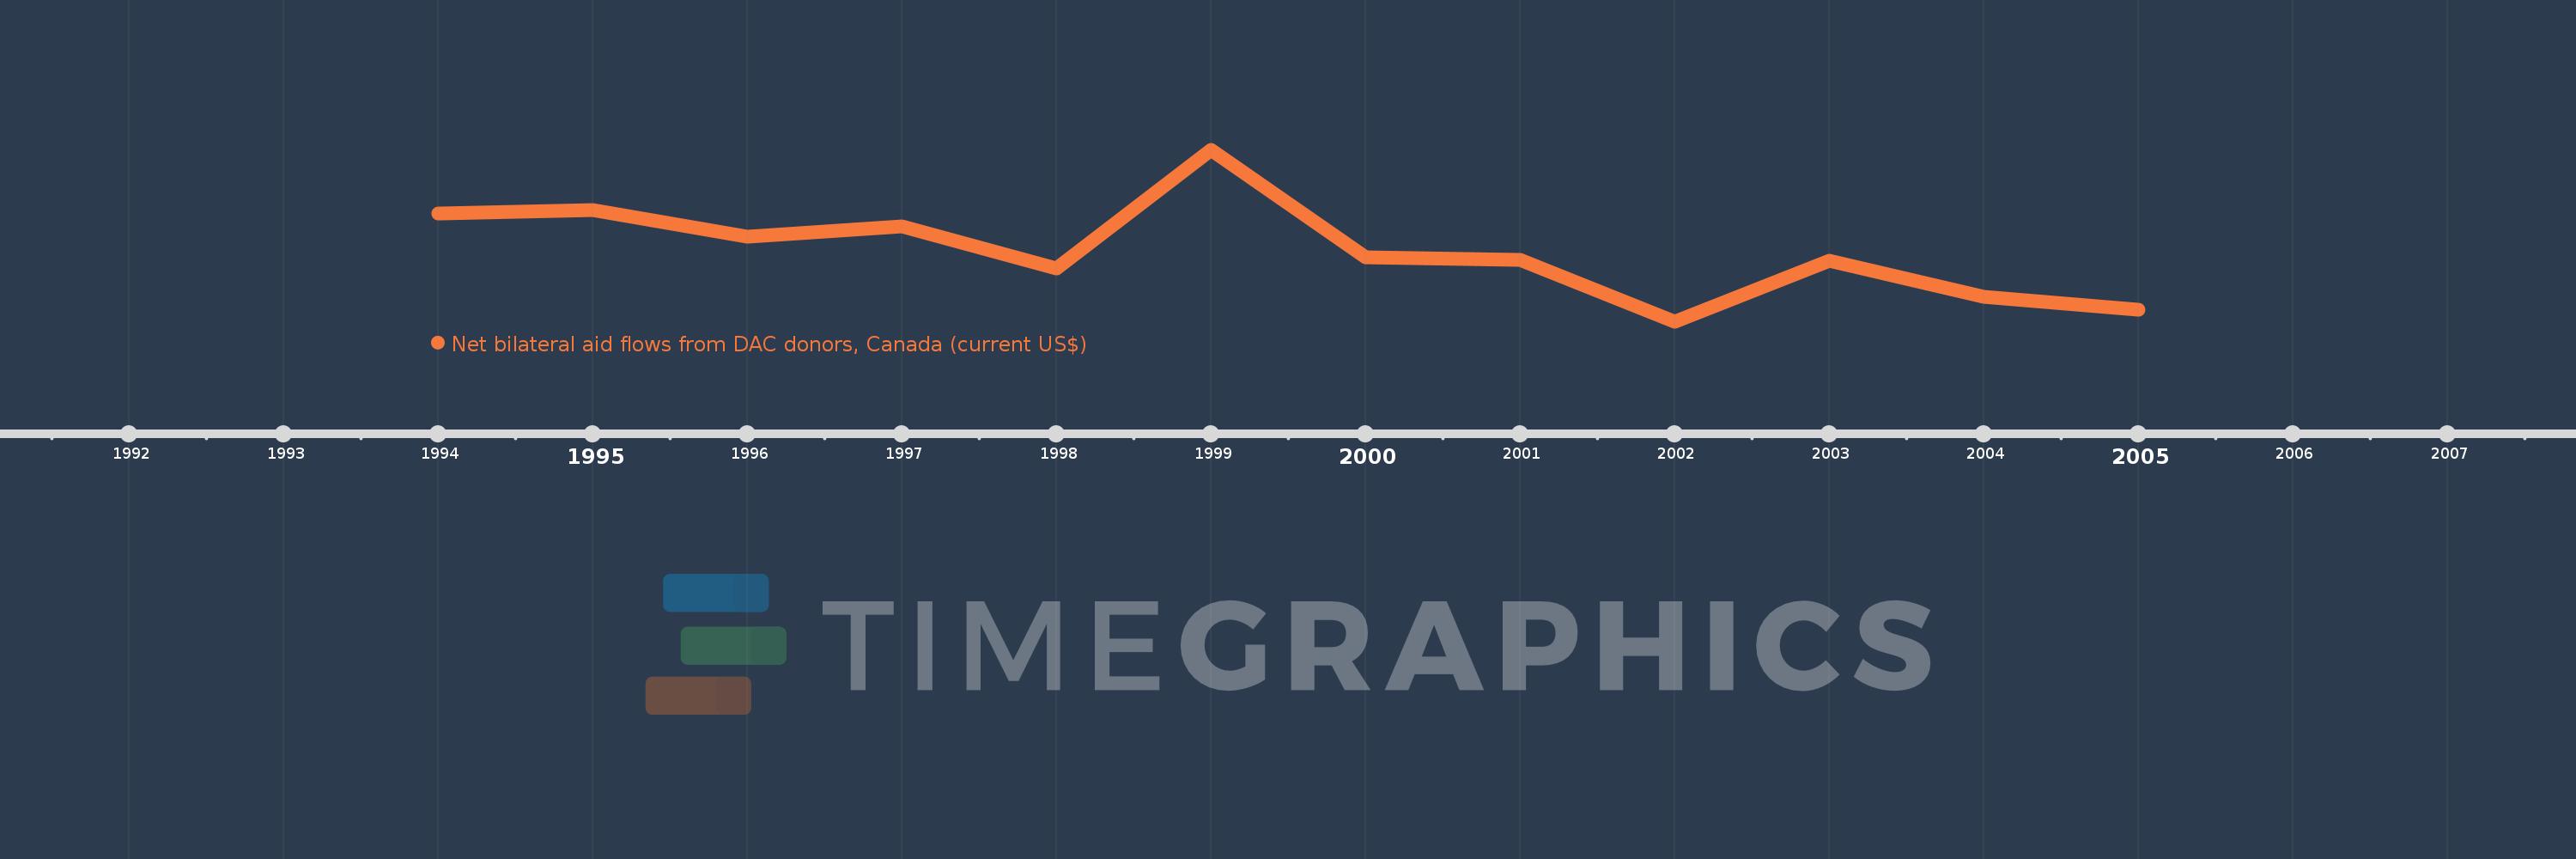
This timeline shows a graph from 1994 to 2005 of Lithuania. No data until 1993. Number of actual observations by date: 12.
Source name:
World Development Indicators
Source organization:
Development Assistance Committee of the Organisation for Economic Co-operation and Development, Geographical Distribution of Financial Flows to Developing Countries, Development Co-operation Report, and International Development Statistics database. Data are available online at: www.oecd.org/dac/stats/idsonline.
Categories, topics:
Aid Effectiveness
Last updated:
apr 23, 2017
Indicators value changes by year
Meaning:
893.333K
Minimum:
150.0K
jan 1, 2002
Maximum:
1.95 mln
jan 1, 1999
At the date of observation
Value
Absolute change
Change from the previous value
jan 1, 1994
1.29 mln
+1.29 mln
0.0%
jan 1, 1995
1.32 mln
+30.0K
2.33%
jan 1, 1996
1.04 mln
-280.0K
-21.21%
jan 1, 1997
1.15 mln
+110.0K
10.58%
jan 1, 1998
710.0K
-440.0K
-38.26%
jan 1, 1999
1.95 mln
+1.24 mln
174.65%
jan 1, 2000
830.0K
-1.12 mln
-57.44%
jan 1, 2001
800.0K
-30.0K
-3.61%
jan 1, 2002
150.0K
-650.0K
-81.25%
jan 1, 2003
790.0K
+640.0K
426.67%
jan 1, 2004
410.0K
-380.0K
-48.1%
jan 1, 2005
280.0K
-130.0K
-31.71%
Ranking of countries by current statistics by years
