29
/
en
AIzaSyAYiBZKx7MnpbEhh9jyipgxe19OcubqV5w
April 1, 2024
71702
Armenia
ARM
true
2
1
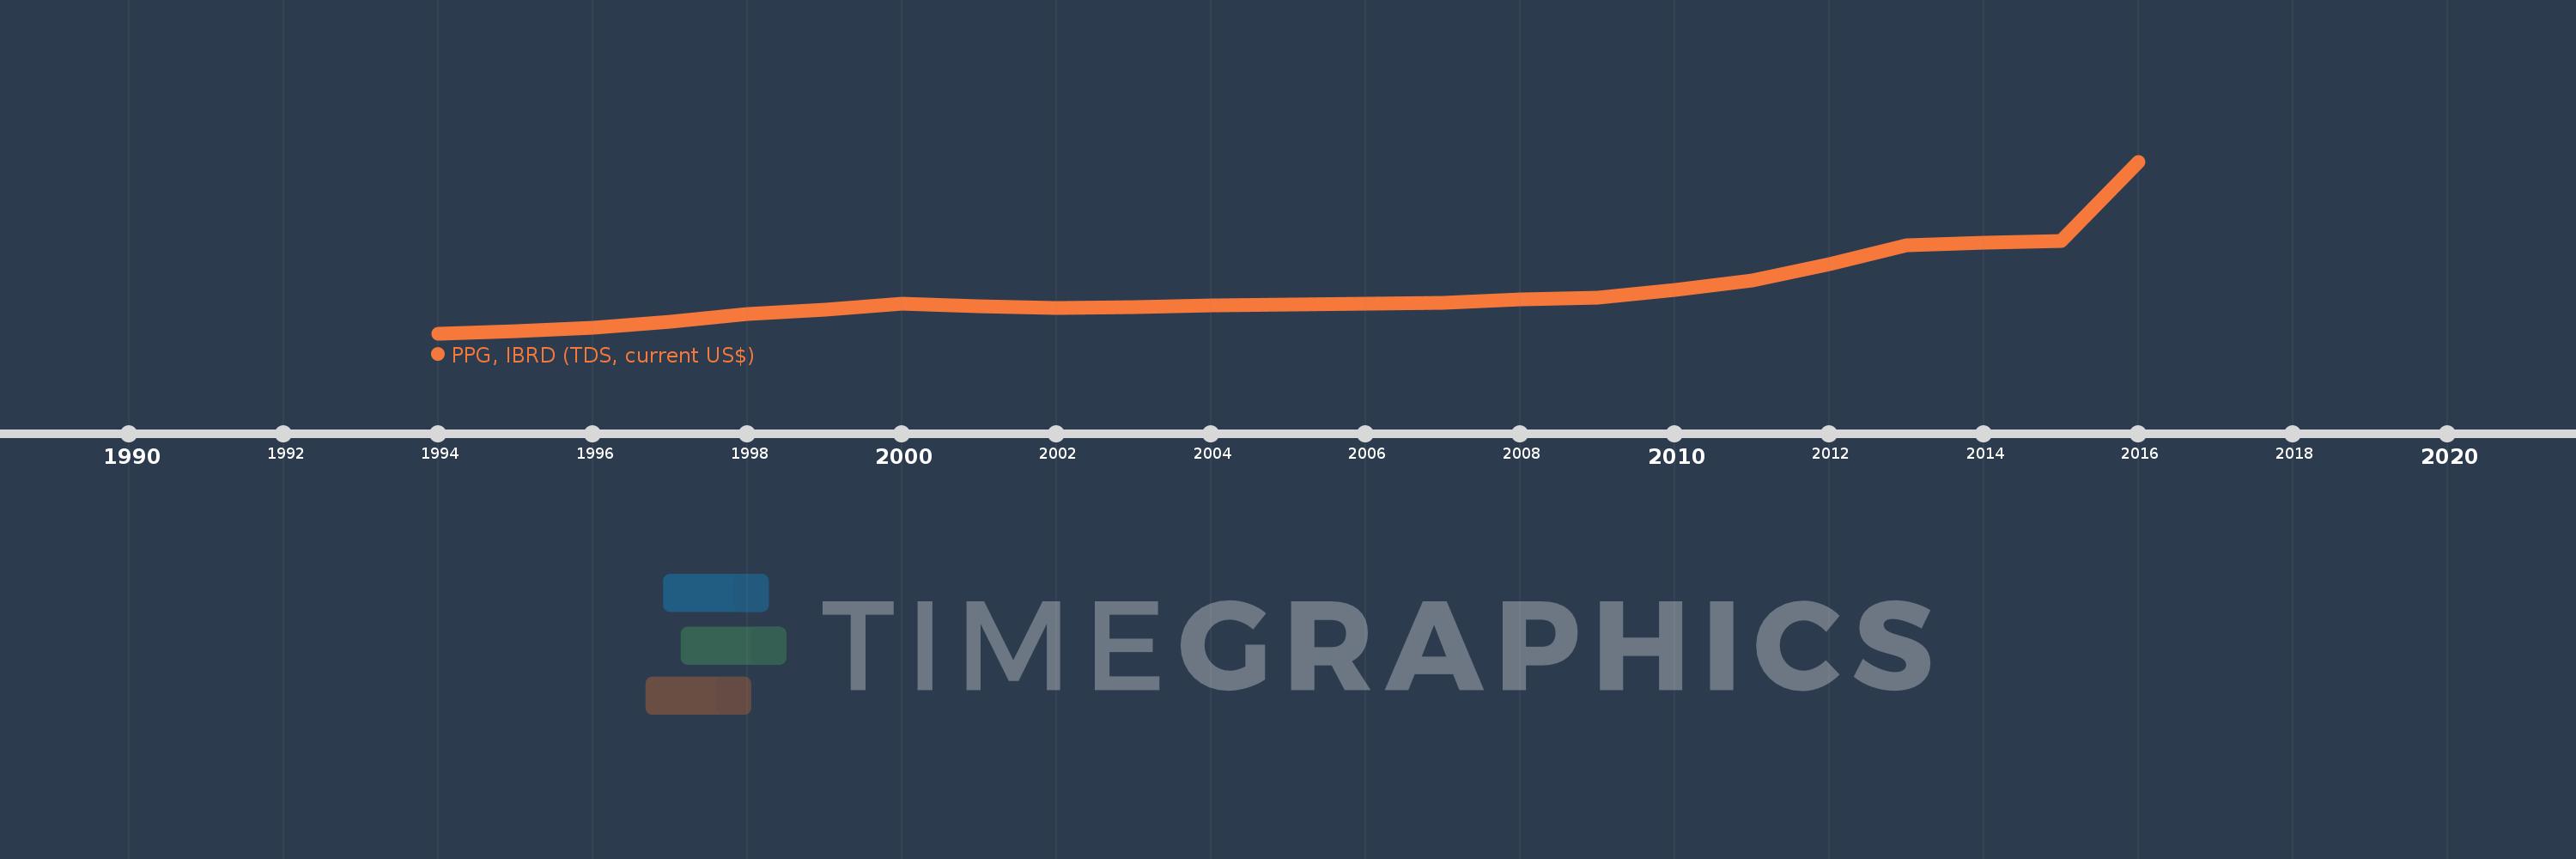
PPG, IBRD (TDS, current US$)
2016,2015,2014,2013,2012,2011,2010,2009,2008,2007,2006,2005,2004,2003,2002,2001,2000,1999,1998,1997,1996,1995,1994
This statistics in other country:
Timeline:
This timeline shows a graph from 1994 to 2016 of Armenia. No data until 1993. Number of actual observations by date: 23.
Source name:
World Development Indicators
Source organization:
World Bank, International Debt Statistics.
Categories, topics:
External Debt
Last updated:
apr 23, 2017
Indicators value changes by year
Maximum:
5.422 mln
jan 1, 2016
At the date of observation
Value
Absolute change
Change from previous value
jan 1, 1994
8.0K
+8.0K
0.0%
jan 1, 1995
71.0K
+63.0K
787.5%
jan 1, 1996
181.0K
+110.0K
154.93%
jan 1, 1997
380.0K
+199.0K
109.94%
jan 1, 1998
621.0K
+241.0K
63.42%
jan 1, 1999
751.0K
+130.0K
20.93%
jan 1, 2000
946.0K
+195.0K
25.97%
jan 1, 2001
858.0K
-88.0K
-9.3%
jan 1, 2002
820.0K
-38.0K
-4.43%
jan 1, 2003
835.0K
+15.0K
1.83%
jan 1, 2004
879.0K
+44.0K
5.27%
jan 1, 2005
910.0K
+31.0K
3.53%
jan 1, 2006
953.0K
+43.0K
4.73%
jan 1, 2007
970.0K
+17.0K
1.78%
jan 1, 2008
1.07 mln
+100.0K
10.31%
jan 1, 2009
1.14 mln
+70.0K
6.54%
jan 1, 2010
1.363 mln
+223.0K
19.56%
jan 1, 2011
1.672 mln
+309.0K
22.67%
jan 1, 2012
2.181 mln
+509.0K
30.44%
jan 1, 2013
2.778 mln
+597.0K
27.37%
jan 1, 2014
2.869 mln
+91.0K
3.28%
jan 1, 2015
2.923 mln
+54.0K
1.88%
jan 1, 2016
5.422 mln
+2.499 mln
85.49%
Ranking of countries by current statistics by years


Comments: