29
/
en
AIzaSyAYiBZKx7MnpbEhh9jyipgxe19OcubqV5w
April 1, 2024
143430
Grenada
GRD
true
2
1
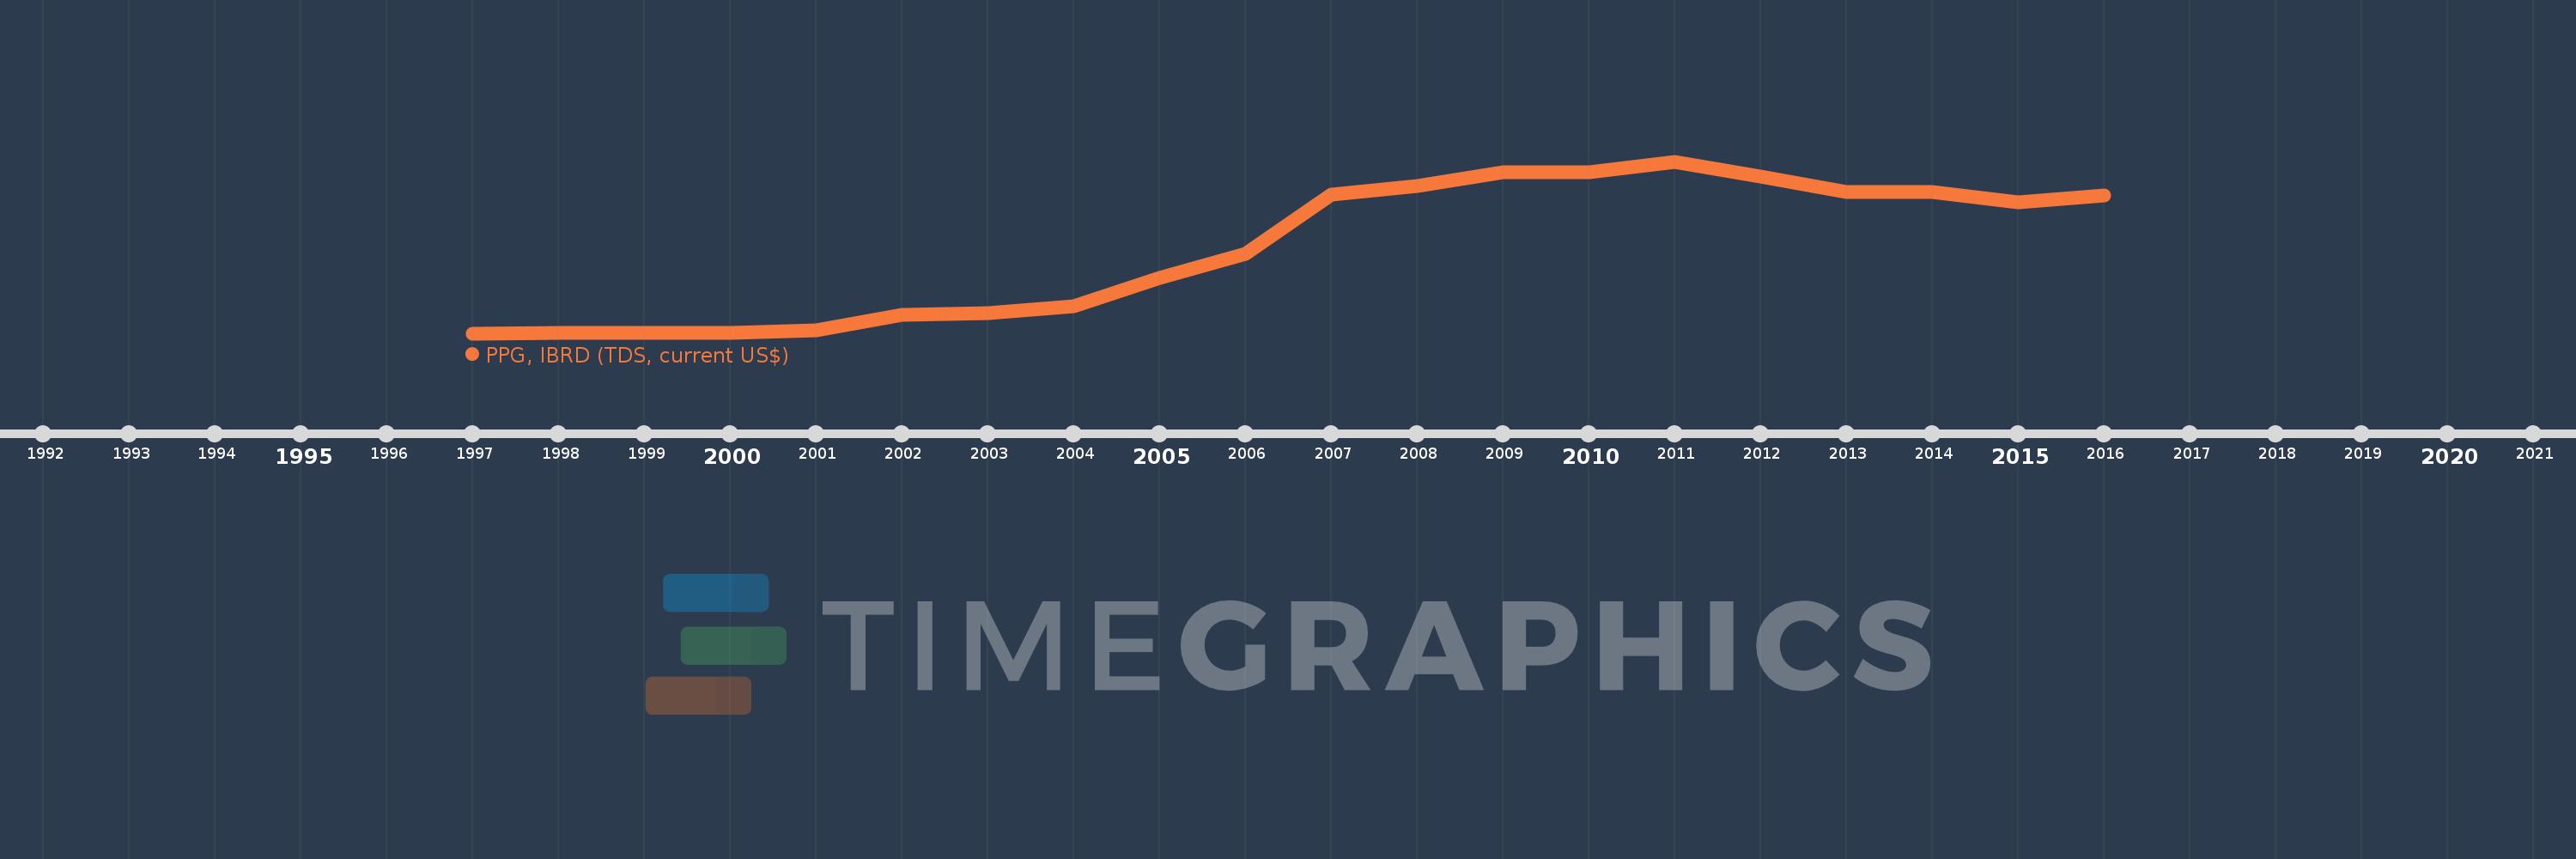
PPG, IBRD (TDS, current US$)
2016,2015,2014,2013,2012,2011,2010,2009,2008,2007,2006,2005,2004,2003,2002,2001,2000,1999,1998,1997
This statistics in other country:
Timeline:
This timeline shows a graph from 1997 to 2016 of Grenada. No data until 1996. Number of actual observations by date: 20.
Source name:
World Development Indicators
Source organization:
World Bank, International Debt Statistics.
Categories, topics:
External Debt
Last updated:
apr 23, 2017
Indicators value changes by year
Maximum:
2.06 mln
jan 1, 2011
At the date of observation
Value
Absolute change
Change from previous value
jan 1, 1997
4.0K
+4.0K
0.0%
jan 1, 1998
10.0K
+6.0K
150.0%
jan 1, 1999
10.0K
0.0
0.0%
jan 1, 2000
12.0K
+2.0K
20.0%
jan 1, 2001
39.0K
+27.0K
225.0%
jan 1, 2002
230.0K
+191.0K
489.74%
jan 1, 2003
247.0K
+17.0K
7.39%
jan 1, 2004
330.0K
+83.0K
33.6%
jan 1, 2005
666.0K
+336.0K
101.82%
jan 1, 2006
956.0K
+290.0K
43.54%
jan 1, 2007
1.666 mln
+710.0K
74.27%
jan 1, 2008
1.765 mln
+99.0K
5.94%
jan 1, 2009
1.931 mln
+166.0K
9.41%
jan 1, 2010
1.933 mln
+2.0K
0.1%
jan 1, 2011
2.06 mln
+127.0K
6.57%
jan 1, 2012
1.875 mln
-185.0K
-8.98%
jan 1, 2013
1.699 mln
-176.0K
-9.39%
jan 1, 2014
1.69 mln
-9.0K
-0.53%
jan 1, 2015
1.571 mln
-119.0K
-7.04%
jan 1, 2016
1.65 mln
+79.0K
5.03%
Ranking of countries by current statistics by years


Comments: