29
/
en
AIzaSyAYiBZKx7MnpbEhh9jyipgxe19OcubqV5w
April 1, 2024
138589
Georgia
GEO
true
2
1
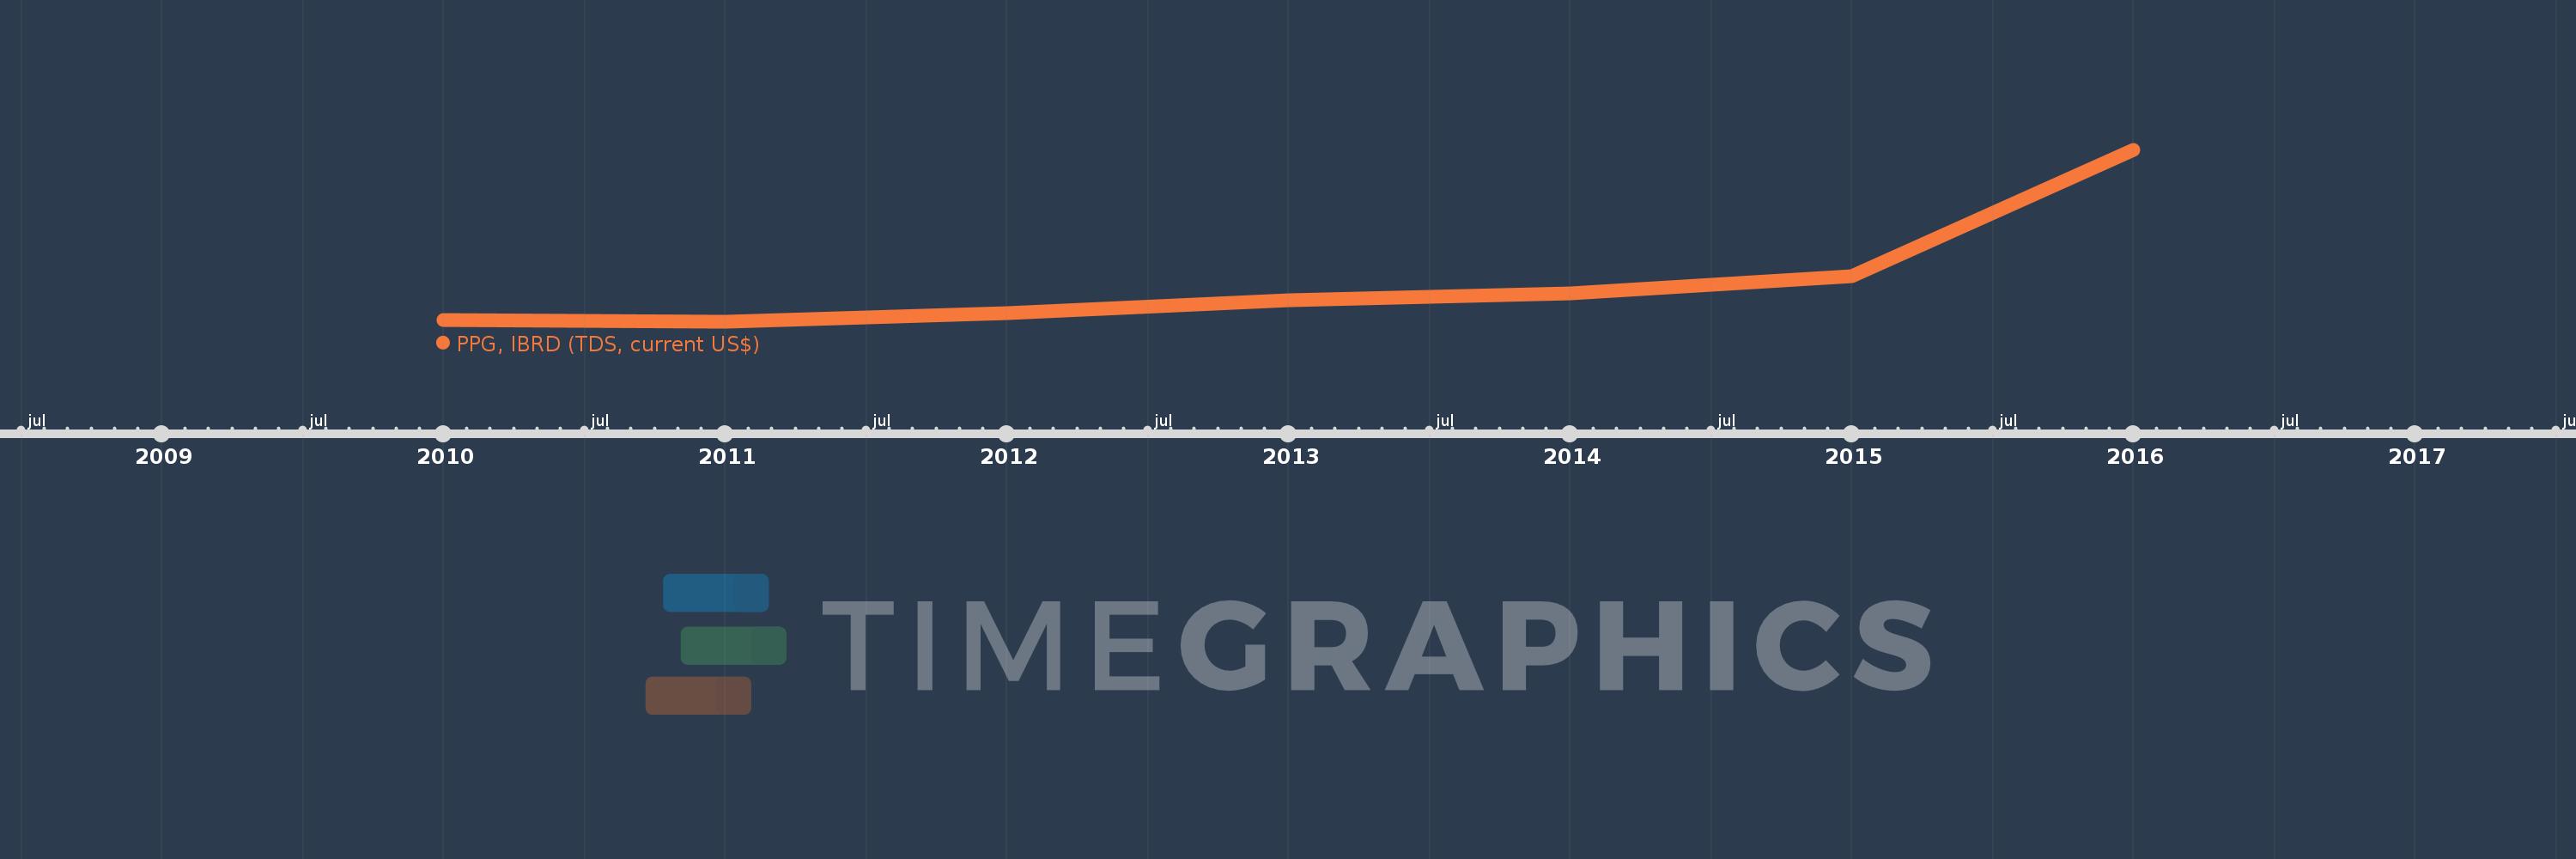
PPG, IBRD (TDS, current US$)
2016,2015,2014,2013,2012,2011,2010
This statistics in other country:
Timeline:
This timeline shows a graph from 2010 to 2016 of Georgia. No data until 2009. Number of actual observations by date: 7.
Source name:
World Development Indicators
Source organization:
World Bank, International Debt Statistics.
Categories, topics:
External Debt
Last updated:
apr 23, 2017
Indicators value changes by year
Minimum:
548.0K
jan 1, 2011
Maximum:
15.275 mln
jan 1, 2016
At the date of observation
Value
Absolute change
Change from previous value
jan 1, 2010
737.0K
+737.0K
0.0%
jan 1, 2011
548.0K
-189.0K
-25.64%
jan 1, 2012
1.318 mln
+770.0K
140.51%
jan 1, 2013
2.444 mln
+1.126 mln
85.43%
jan 1, 2014
3.01 mln
+566.0K
23.16%
jan 1, 2015
4.451 mln
+1.441 mln
47.87%
jan 1, 2016
15.275 mln
+10.824 mln
243.18%
Ranking of countries by current statistics by years


Comments: