29
/
en
AIzaSyAYiBZKx7MnpbEhh9jyipgxe19OcubqV5w
April 1, 2024
69968
Argentina
ARG
true
2
1
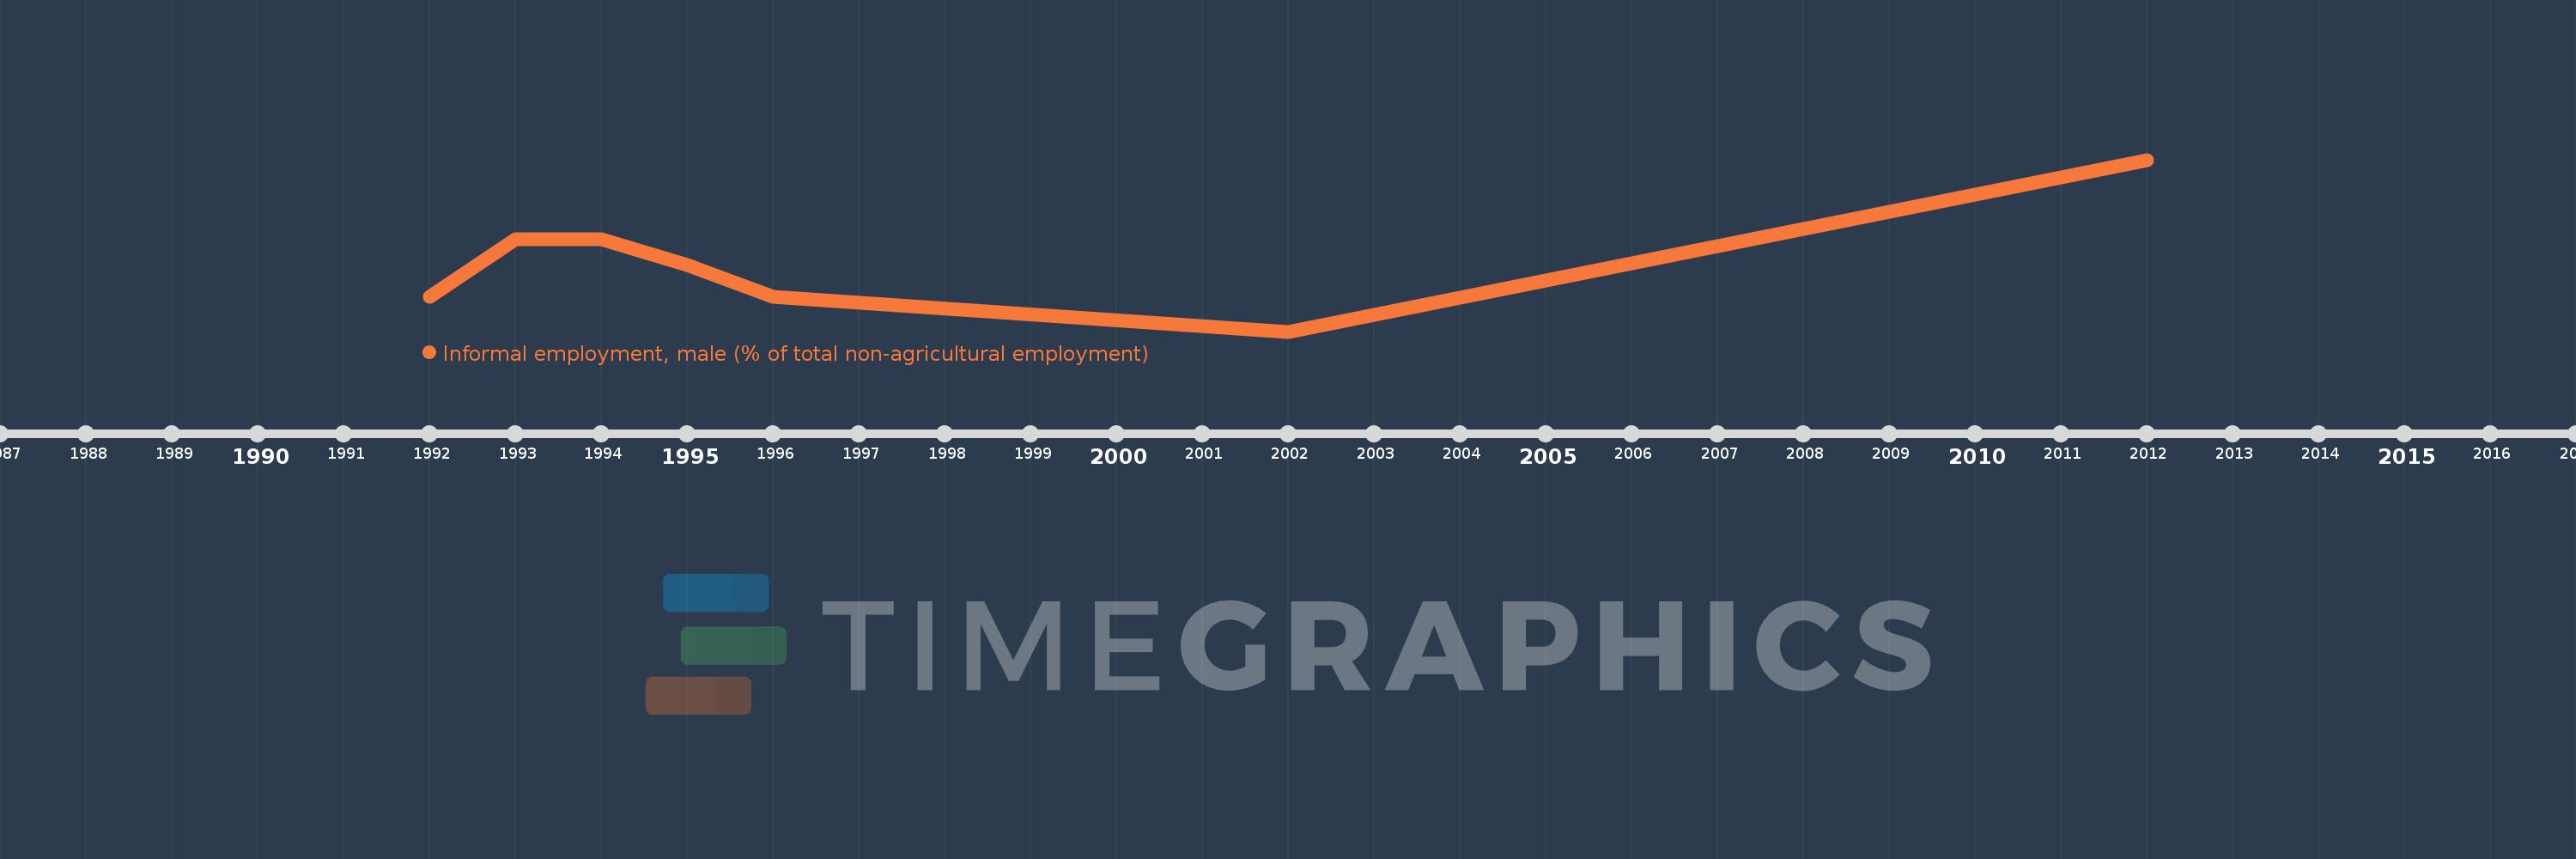
Informal employment, male (% of total non-agricultural employment)
2012,2002,1996,1995,1994,1993,1992
This statistics in other country:
Timeline:
This timeline shows a graph from 1992 to 2012 of Argentina. No data until 1991. Number of actual observations by date: 7.
Source name:
World Development Indicators
Source organization:
International Labour Organization, Key Indicators of the Labour Market database.
Categories, topics:
Social Protection & Labor
Last updated:
apr 23, 2017
Indicators value changes by year
At the date of observation
Value
Absolute change
Change from previous value
jan 1, 1992
41.9
+41.9
0.0%
jan 1, 1993
43.7
+1.8
4.3%
jan 1, 1995
42.9
-0.8
-1.83%
jan 1, 1996
41.9
-1.0
-2.33%
jan 1, 2002
40.8
-1.1
-2.63%
jan 1, 2012
46.2
+5.4
13.24%
Ranking of countries by current statistics by years


Comments: