29
/
en
AIzaSyAYiBZKx7MnpbEhh9jyipgxe19OcubqV5w
April 1, 2024
107407
Colombia
COL
true
2
1
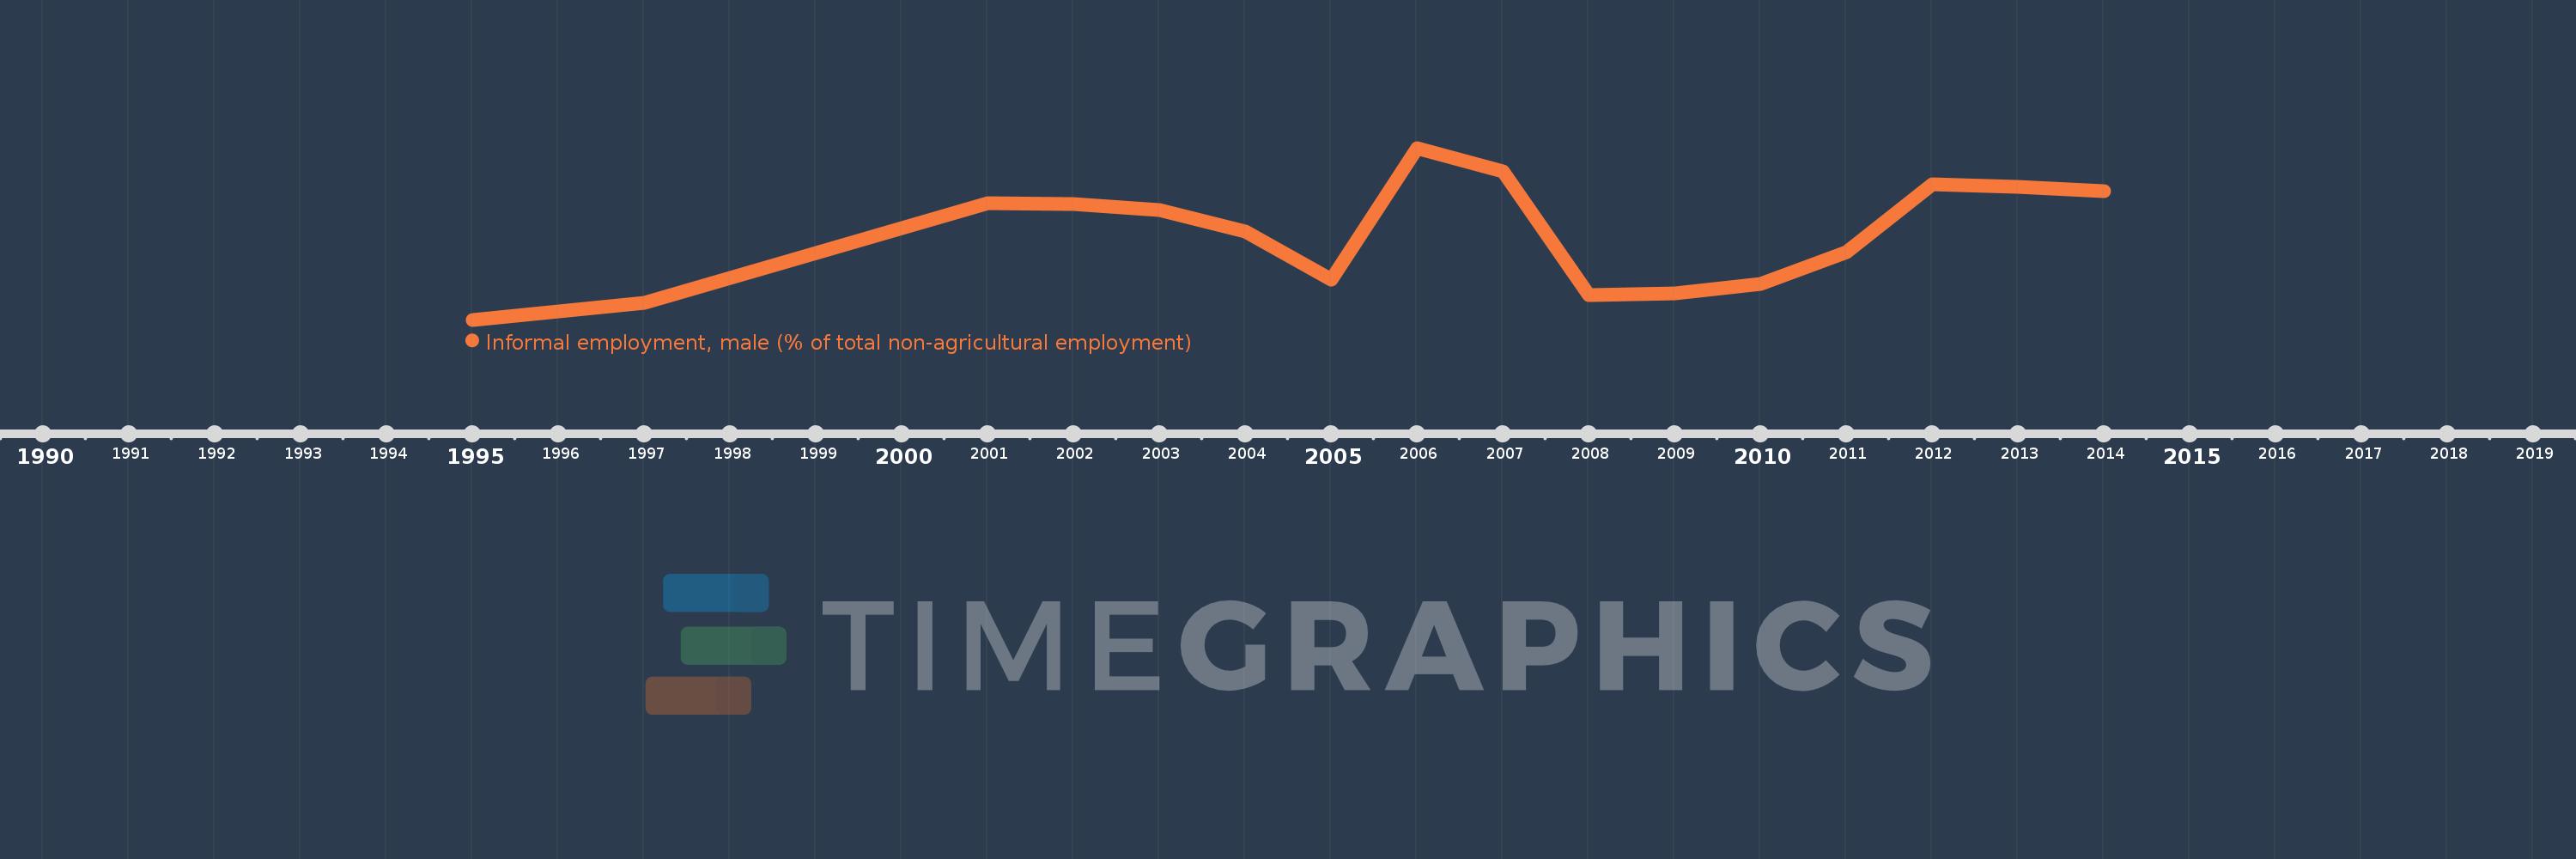
Informal employment, male (% of total non-agricultural employment)
2014,2013,2012,2011,2010,2009,2008,2007,2006,2005,2004,2003,2002,2001,1997,1995
This statistics in other country:
Timeline:
This timeline shows a graph from 1995 to 2014 of Colombia. No data until 1994. Number of actual observations by date: 16.
Source name:
World Development Indicators
Source organization:
International Labour Organization, Key Indicators of the Labour Market database.
Categories, topics:
Social Protection & Labor
Last updated:
apr 23, 2017
Indicators value changes by year
At the date of observation
Value
Absolute change
Change from previous value
jan 1, 1995
52.3
+52.3
0.0%
jan 1, 1997
53.5
+1.2
2.29%
jan 1, 2001
60.4
+6.9
12.9%
jan 1, 2002
60.3
-0.1
-0.17%
jan 1, 2003
59.9
-0.4
-0.66%
jan 1, 2004
58.4
-1.5
-2.5%
jan 1, 2005
55.1
-3.3
-5.65%
jan 1, 2006
64.2
+9.1
16.52%
jan 1, 2007
62.6
-1.6
-2.49%
jan 1, 2008
54.0
-8.6
-13.74%
jan 1, 2009
54.1
+0.1
0.19%
jan 1, 2010
54.8
+0.7
1.29%
jan 1, 2011
57.0
+2.2
4.01%
jan 1, 2012
61.7
+4.7
8.25%
jan 1, 2013
61.5
-0.2
-0.32%
jan 1, 2014
61.2
-0.3
-0.49%
Ranking of countries by current statistics by years


Comments: