29
/
en
AIzaSyAYiBZKx7MnpbEhh9jyipgxe19OcubqV5w
April 1, 2024
122286
Dominican Republic
DOM
true
2
1
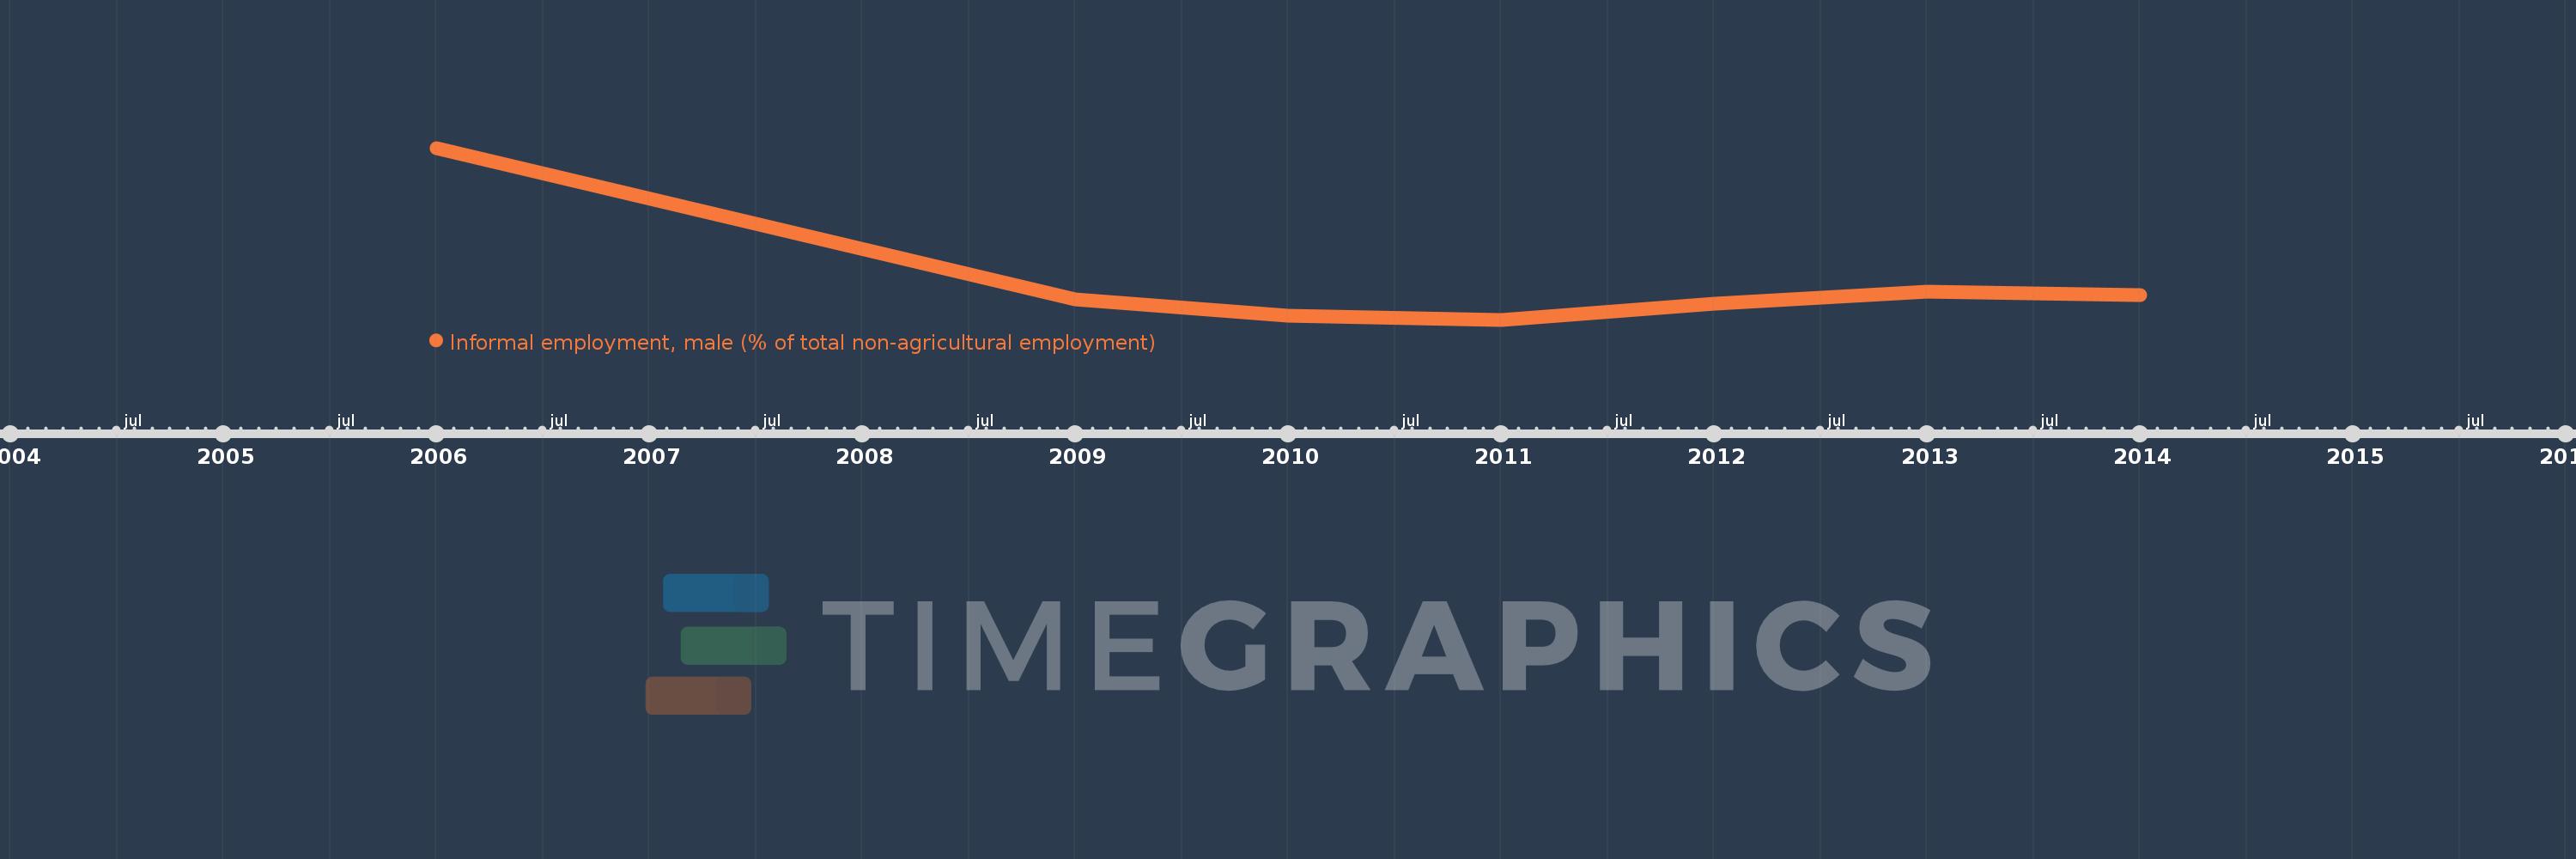
Informal employment, male (% of total non-agricultural employment)
2014,2013,2012,2011,2010,2009,2006
This statistics in other country:
Timeline:
This timeline shows a graph from 2006 to 2014 of Dominican Republic. No data until 2005. Number of actual observations by date: 7.
Source name:
World Development Indicators
Source organization:
International Labour Organization, Key Indicators of the Labour Market database.
Categories, topics:
Social Protection & Labor
Last updated:
apr 23, 2017
Indicators value changes by year
At the date of observation
Value
Absolute change
Change from previous value
jan 1, 2006
74.3
+74.3
0.0%
jan 1, 2009
49.4
-24.9
-33.51%
jan 1, 2010
46.7
-2.7
-5.47%
jan 1, 2011
46.0
-0.7
-1.5%
jan 1, 2012
48.6
+2.6
5.65%
jan 1, 2013
50.6
+2.0
4.12%
jan 1, 2014
50.1
-0.5
-0.99%
Ranking of countries by current statistics by years


Comments: