29
/
en
AIzaSyAYiBZKx7MnpbEhh9jyipgxe19OcubqV5w
April 1, 2024
67844
Angola
AGO
true
2
1
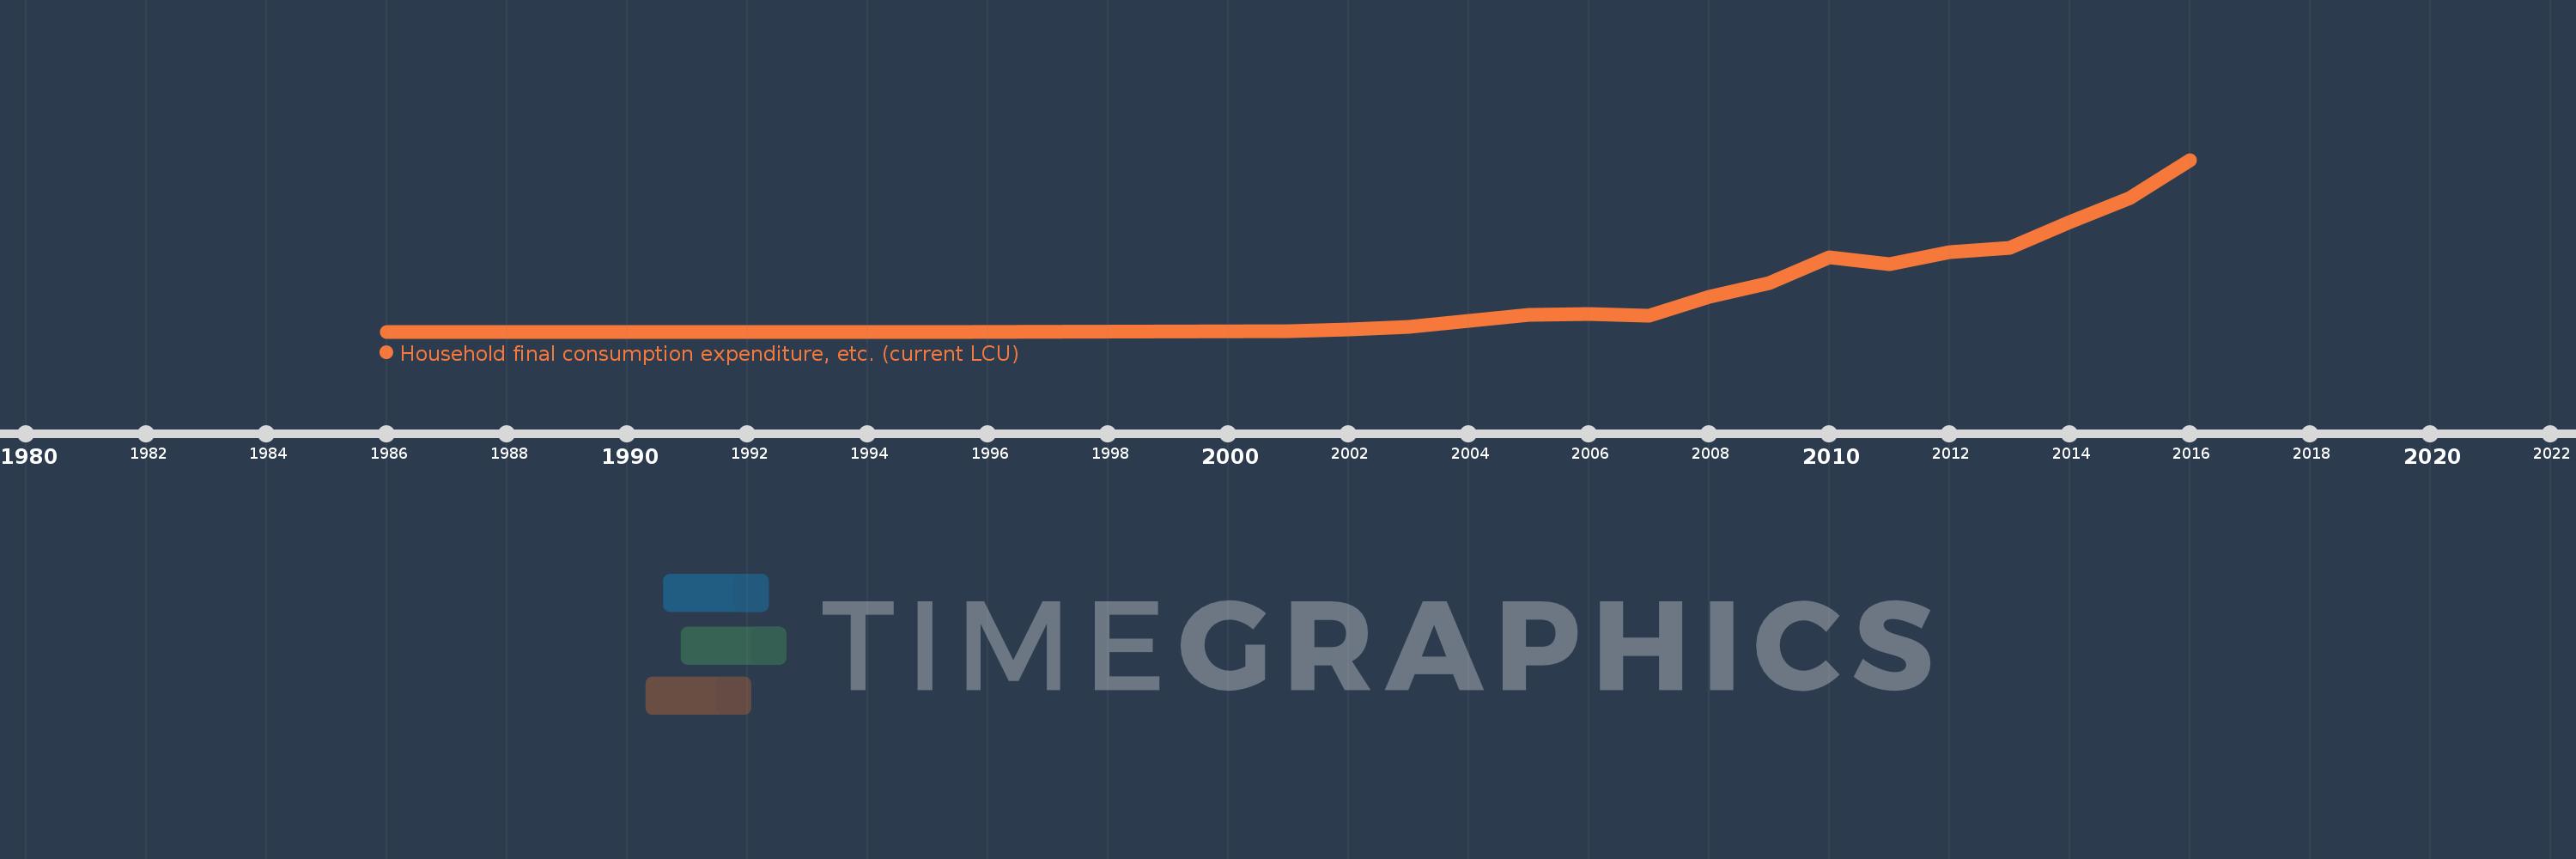
Household final consumption expenditure, etc. (current LCU)
2016,2015,2014,2013,2012,2011,2010,2009,2008,2007,2006,2005,2004,2003,2002,2001,1995,1994,1993,1992,1991,1990,1989,1988,1987,1986
This statistics in other country:
AfghanistanAlbaniaAlgeriaAngolaAntigua and BarbudaArgentinaArmeniaArubaAustraliaAustriaAzerbaijanBahamas, TheBahrainBangladeshBarbadosBelarusBelgiumBelizeBeninBermudaBhutanBoliviaBosnia and HerzegovinaBotswanaBrazilBrunei DarussalamBulgariaBurkina FasoBurundiCabo VerdeCambodiaCameroonCanadaCentral African RepublicChadChileChinaColombiaComorosCongo, Dem. Rep.Congo, Rep.Costa RicaCote d'IvoireCroatiaCubaCyprusCzech RepublicDenmarkDjiboutiDominicaDominican RepublicEcuadorEgypt, Arab Rep.El SalvadorEquatorial GuineaEritreaEstoniaEthiopiaFaroe IslandsFijiFinlandFranceGabonGambia, TheGeorgiaGermanyGhanaGreeceGrenadaGuatemalaGuineaGuinea-BissauGuyanaHaitiHondurasHong Kong SAR, ChinaHungaryIcelandIndiaIndonesiaIran, Islamic Rep.IraqIrelandIsraelItalyJamaicaJapanJordanKazakhstanKenyaKiribatiKorea, Rep.KosovoKuwaitKyrgyz RepublicLao PDRLatviaLebanonLesothoLiberiaLibyaLithuaniaLuxembourgMacao SAR, ChinaMacedonia, FYRMadagascarMalawiMalaysiaMaldivesMaliMaltaMauritaniaMauritiusMexicoMicronesia, Fed. Sts.MoldovaMongoliaMontenegroMoroccoMozambiqueNamibiaNepalNetherlandsNew CaledoniaNew ZealandNicaraguaNigerNigeriaNorwayOmanPakistanPanamaPapua New GuineaParaguayPeruPhilippinesPolandPortugalPuerto RicoQatarRomaniaRussian FederationRwandaSaudi ArabiaSenegalSerbiaSeychellesSierra LeoneSingaporeSlovak RepublicSloveniaSolomon IslandsSomaliaSouth AfricaSouth SudanSpainSri LankaSt. Kitts and NevisSt. LuciaSt. Vincent and the GrenadinesSudanSurinameSwazilandSwedenSwitzerlandSyrian Arab RepublicTajikistanTanzaniaThailandTimor-LesteTogoTongaTrinidad and TobagoTunisiaTurkeyTurkmenistanUgandaUkraineUnited Arab EmiratesUnited KingdomUnited StatesUruguayUzbekistanVanuatuVenezuela, RBVietnamWest Bank and GazaYemen, Rep.ZambiaZimbabwe Timeline:
This timeline shows a graph from 1986 to 2016 of Angola. No data until 1985. Number of actual observations by date: 26.
Source name:
World Development Indicators
Source organization:
World Bank national accounts data, and OECD National Accounts data files.
Categories, topics:
Economy & Growth
Last updated:
apr 23, 2017
Indicators value changes by year
Maximum:
9.342 trl
jan 1, 2016
At the date of observation
Value
Absolute change
Change from previous value
jan 1, 1986
100.0
+100.0
0.0%
jan 1, 1987
100.0
0.0
0.0%
jan 1, 1988
100.0
0.0
0.0%
jan 1, 1989
100.0
0.0
0.0%
jan 1, 1990
200.0
+100.0
100.0%
jan 1, 1991
200.0
0.0
0.0%
jan 1, 1992
300.0
+100.0
50.0%
jan 1, 1993
1.5K
+1.2K
400.0%
jan 1, 1994
13.1K
+11.6K
773.33%
jan 1, 1995
209.6K
+196.5K
1.5K%
jan 1, 2001
16.444 bln
+16.444 bln
7.85 mln%
jan 1, 2002
120.143 bln
+103.699 bln
630.62%
jan 1, 2003
270.4 bln
+150.257 bln
125.07%
jan 1, 2004
562.126 bln
+291.726 bln
107.89%
jan 1, 2005
899.541 bln
+337.415 bln
60.02%
jan 1, 2006
956.19 bln
+56.649 bln
6.3%
jan 1, 2007
852.031 bln
-104.159 bln
-10.89%
jan 1, 2008
1.891 trl
+1.039 trl
121.9%
jan 1, 2009
2.625 trl
+734.167 bln
38.83%
jan 1, 2010
4.058 trl
+1.434 trl
54.62%
jan 1, 2011
3.674 trl
-384.469 bln
-9.47%
jan 1, 2012
4.336 trl
+661.744 bln
18.01%
jan 1, 2013
4.545 trl
+209.474 bln
4.83%
jan 1, 2014
5.932 trl
+1.387 trl
30.51%
jan 1, 2015
7.263 trl
+1.331 trl
22.43%
jan 1, 2016
9.342 trl
+2.079 trl
28.62%
Ranking of countries by current statistics by years


Comments: