29
/
en
AIzaSyAYiBZKx7MnpbEhh9jyipgxe19OcubqV5w
April 1, 2024
227507
Qatar
QAT
true
2
1
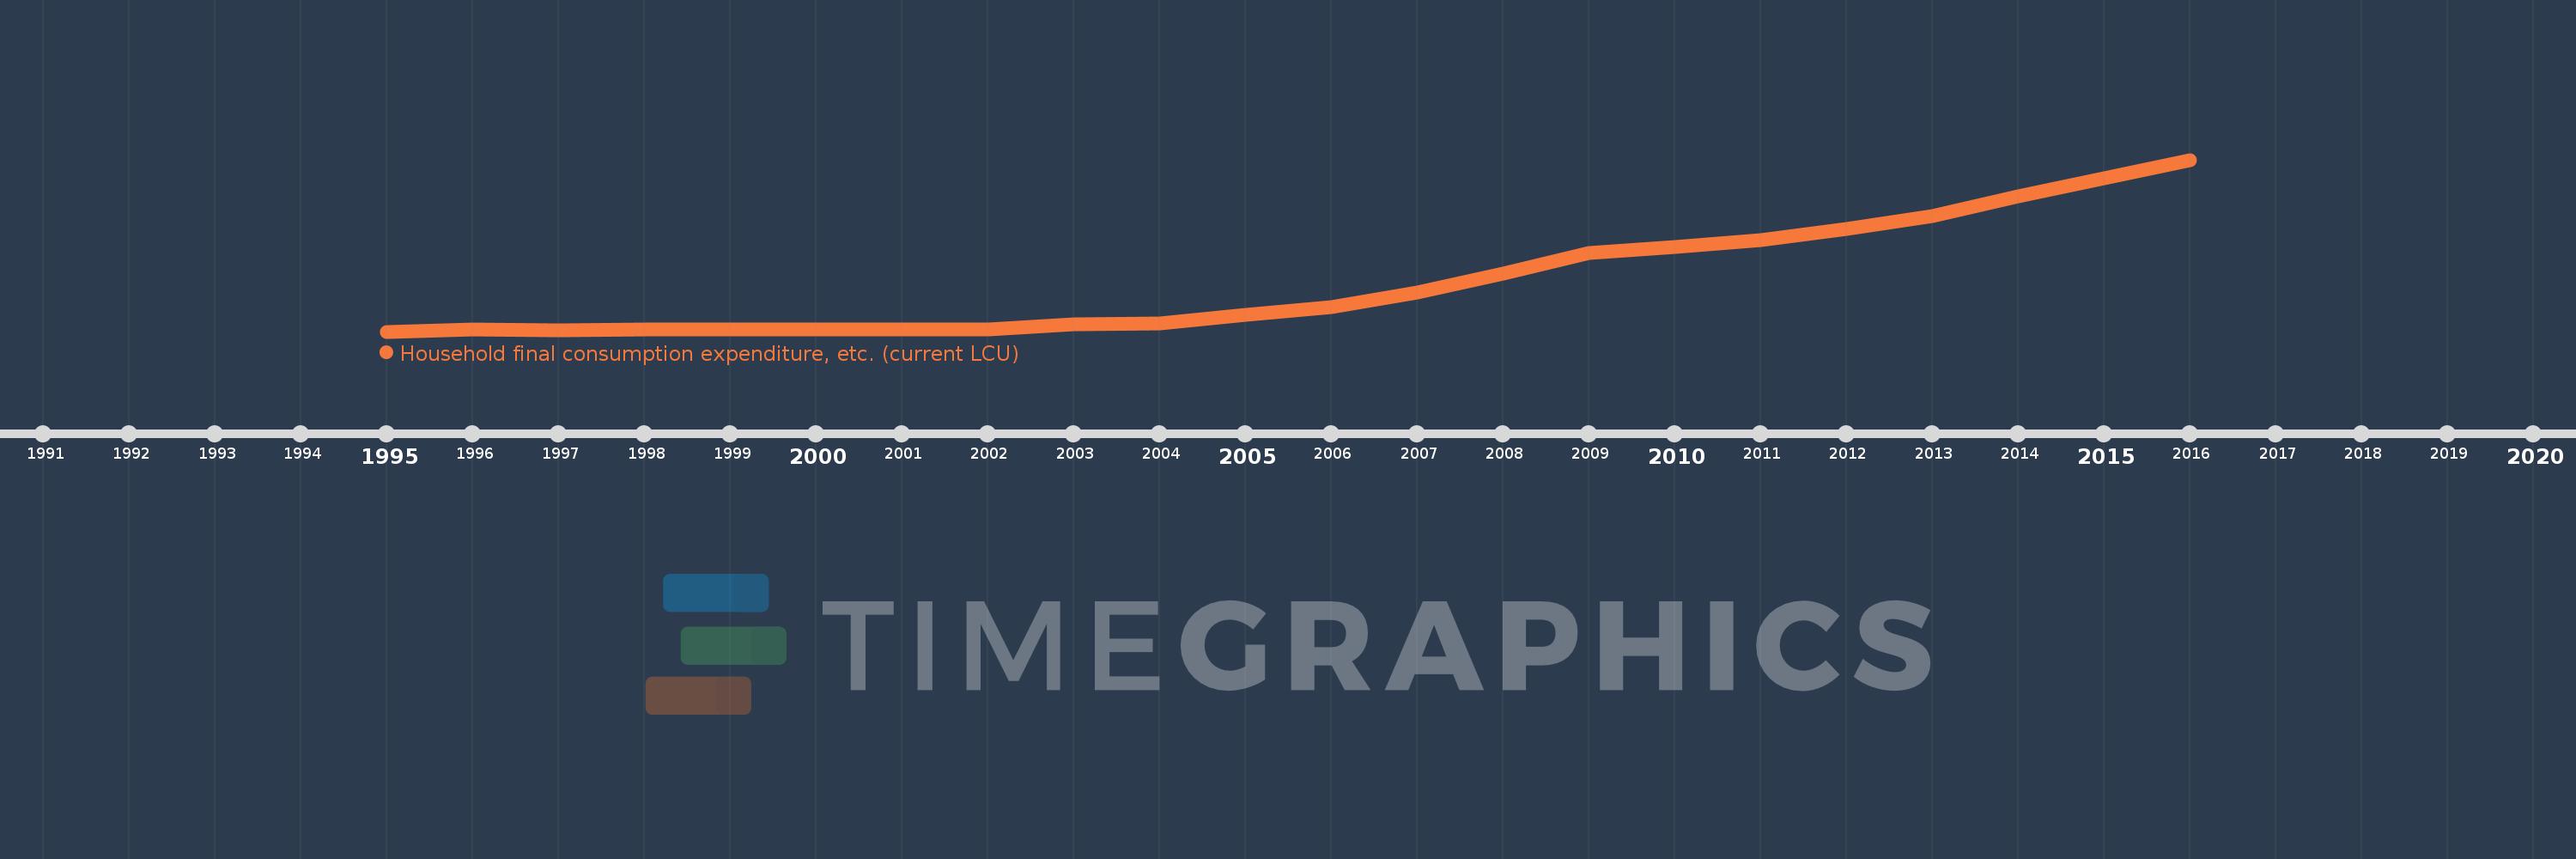
Household final consumption expenditure, etc. (current LCU)
2016,2015,2014,2013,2012,2011,2010,2009,2008,2007,2006,2005,2004,2003,2002,2001,2000,1999,1998,1997,1996,1995
This statistics in other country:
AfghanistanAlbaniaAlgeriaAngolaAntigua and BarbudaArgentinaArmeniaArubaAustraliaAustriaAzerbaijanBahamas, TheBahrainBangladeshBarbadosBelarusBelgiumBelizeBeninBermudaBhutanBoliviaBosnia and HerzegovinaBotswanaBrazilBrunei DarussalamBulgariaBurkina FasoBurundiCabo VerdeCambodiaCameroonCanadaCentral African RepublicChadChileChinaColombiaComorosCongo, Dem. Rep.Congo, Rep.Costa RicaCote d'IvoireCroatiaCubaCyprusCzech RepublicDenmarkDjiboutiDominicaDominican RepublicEcuadorEgypt, Arab Rep.El SalvadorEquatorial GuineaEritreaEstoniaEthiopiaFaroe IslandsFijiFinlandFranceGabonGambia, TheGeorgiaGermanyGhanaGreeceGrenadaGuatemalaGuineaGuinea-BissauGuyanaHaitiHondurasHong Kong SAR, ChinaHungaryIcelandIndiaIndonesiaIran, Islamic Rep.IraqIrelandIsraelItalyJamaicaJapanJordanKazakhstanKenyaKiribatiKorea, Rep.KosovoKuwaitKyrgyz RepublicLao PDRLatviaLebanonLesothoLiberiaLibyaLithuaniaLuxembourgMacao SAR, ChinaMacedonia, FYRMadagascarMalawiMalaysiaMaldivesMaliMaltaMauritaniaMauritiusMexicoMicronesia, Fed. Sts.MoldovaMongoliaMontenegroMoroccoMozambiqueNamibiaNepalNetherlandsNew CaledoniaNew ZealandNicaraguaNigerNigeriaNorwayOmanPakistanPanamaPapua New GuineaParaguayPeruPhilippinesPolandPortugalPuerto RicoQatarRomaniaRussian FederationRwandaSaudi ArabiaSenegalSerbiaSeychellesSierra LeoneSingaporeSlovak RepublicSloveniaSolomon IslandsSomaliaSouth AfricaSouth SudanSpainSri LankaSt. Kitts and NevisSt. LuciaSt. Vincent and the GrenadinesSudanSurinameSwazilandSwedenSwitzerlandSyrian Arab RepublicTajikistanTanzaniaThailandTimor-LesteTogoTongaTrinidad and TobagoTunisiaTurkeyTurkmenistanUgandaUkraineUnited Arab EmiratesUnited KingdomUnited StatesUruguayUzbekistanVanuatuVenezuela, RBVietnamWest Bank and GazaYemen, Rep.ZambiaZimbabwe Timeline:
This timeline shows a graph from 1995 to 2016 of Qatar. No data until 1994. Number of actual observations by date: 22.
Source name:
World Development Indicators
Source organization:
World Bank national accounts data, and OECD National Accounts data files.
Categories, topics:
Economy & Growth
Last updated:
apr 23, 2017
Indicators value changes by year
Minimum:
8.03 bln
jan 1, 1995
Maximum:
131.681 bln
jan 1, 2016
At the date of observation
Value
Absolute change
Change from previous value
jan 1, 1995
8.03 bln
+8.03 bln
0.0%
jan 1, 1996
9.494 bln
+1.464 bln
18.23%
jan 1, 1997
8.996 bln
-498.001 mln
-5.25%
jan 1, 1998
9.335 bln
+339.001 mln
3.77%
jan 1, 1999
9.449 bln
+114.002 mln
1.22%
jan 1, 2000
9.525 bln
+75.998 mln
0.8%
jan 1, 2001
9.843 bln
+318.0 mln
3.34%
jan 1, 2002
9.855 bln
+12.0 mln
0.12%
jan 1, 2003
12.983 bln
+3.128 bln
31.74%
jan 1, 2004
14.133 bln
+1.15 bln
8.86%
jan 1, 2005
20.166 bln
+6.033 bln
42.69%
jan 1, 2006
25.889 bln
+5.723 bln
28.38%
jan 1, 2007
36.187 bln
+10.298 bln
39.78%
jan 1, 2008
49.729 bln
+13.542 bln
37.42%
jan 1, 2009
64.676 bln
+14.947 bln
30.06%
jan 1, 2010
68.624 bln
+3.948 bln
6.1%
jan 1, 2011
73.646 bln
+5.022 bln
7.32%
jan 1, 2012
81.903 bln
+8.257 bln
11.21%
jan 1, 2013
91.189 bln
+9.286 bln
11.34%
jan 1, 2014
105.351 bln
+14.162 bln
15.53%
jan 1, 2015
118.461 bln
+13.11 bln
12.44%
jan 1, 2016
131.681 bln
+13.22 bln
11.16%
Ranking of countries by current statistics by years


Comments: