29
/
en
AIzaSyAYiBZKx7MnpbEhh9jyipgxe19OcubqV5w
April 1, 2024
220940
Paraguay
PRY
true
2
1
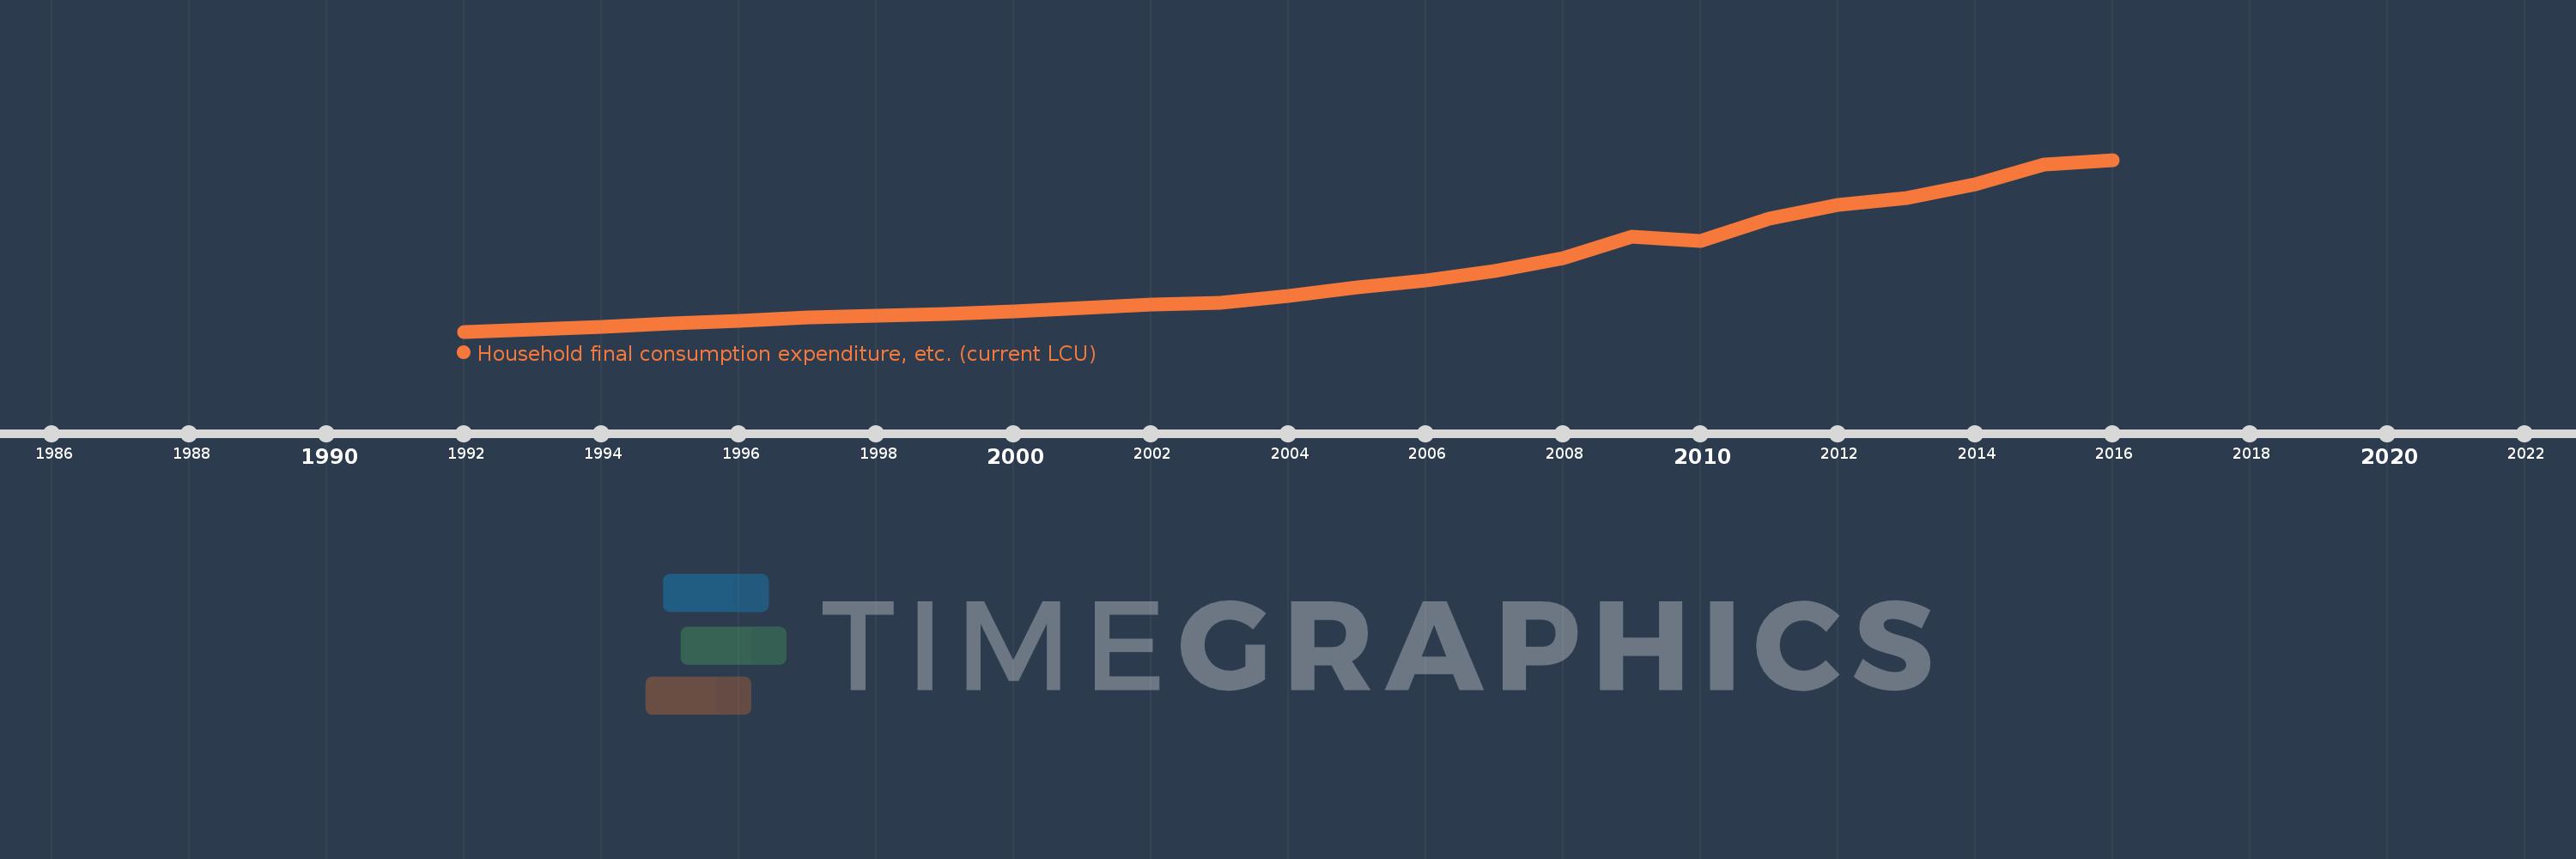
Household final consumption expenditure, etc. (current LCU)
2016,2015,2014,2013,2012,2011,2010,2009,2008,2007,2006,2005,2004,2003,2002,2001,2000,1999,1998,1997,1996,1995,1994,1993,1992
This statistics in other country:
AfghanistanAlbaniaAlgeriaAngolaAntigua and BarbudaArgentinaArmeniaArubaAustraliaAustriaAzerbaijanBahamas, TheBahrainBangladeshBarbadosBelarusBelgiumBelizeBeninBermudaBhutanBoliviaBosnia and HerzegovinaBotswanaBrazilBrunei DarussalamBulgariaBurkina FasoBurundiCabo VerdeCambodiaCameroonCanadaCentral African RepublicChadChileChinaColombiaComorosCongo, Dem. Rep.Congo, Rep.Costa RicaCote d'IvoireCroatiaCubaCyprusCzech RepublicDenmarkDjiboutiDominicaDominican RepublicEcuadorEgypt, Arab Rep.El SalvadorEquatorial GuineaEritreaEstoniaEthiopiaFaroe IslandsFijiFinlandFranceGabonGambia, TheGeorgiaGermanyGhanaGreeceGrenadaGuatemalaGuineaGuinea-BissauGuyanaHaitiHondurasHong Kong SAR, ChinaHungaryIcelandIndiaIndonesiaIran, Islamic Rep.IraqIrelandIsraelItalyJamaicaJapanJordanKazakhstanKenyaKiribatiKorea, Rep.KosovoKuwaitKyrgyz RepublicLao PDRLatviaLebanonLesothoLiberiaLibyaLithuaniaLuxembourgMacao SAR, ChinaMacedonia, FYRMadagascarMalawiMalaysiaMaldivesMaliMaltaMauritaniaMauritiusMexicoMicronesia, Fed. Sts.MoldovaMongoliaMontenegroMoroccoMozambiqueNamibiaNepalNetherlandsNew CaledoniaNew ZealandNicaraguaNigerNigeriaNorwayOmanPakistanPanamaPapua New GuineaParaguayPeruPhilippinesPolandPortugalPuerto RicoQatarRomaniaRussian FederationRwandaSaudi ArabiaSenegalSerbiaSeychellesSierra LeoneSingaporeSlovak RepublicSloveniaSolomon IslandsSomaliaSouth AfricaSouth SudanSpainSri LankaSt. Kitts and NevisSt. LuciaSt. Vincent and the GrenadinesSudanSurinameSwazilandSwedenSwitzerlandSyrian Arab RepublicTajikistanTanzaniaThailandTimor-LesteTogoTongaTrinidad and TobagoTunisiaTurkeyTurkmenistanUgandaUkraineUnited Arab EmiratesUnited KingdomUnited StatesUruguayUzbekistanVanuatuVenezuela, RBVietnamWest Bank and GazaYemen, Rep.ZambiaZimbabwe Timeline:
This timeline shows a graph from 1992 to 2016 of Paraguay. No data until 1991. Number of actual observations by date: 25.
Source name:
World Development Indicators
Source organization:
World Bank national accounts data, and OECD National Accounts data files.
Categories, topics:
Economy & Growth
Last updated:
apr 23, 2017
Indicators value changes by year
Minimum:
5.711 trl
jan 1, 1992
Maximum:
97.698 trl
jan 1, 2016
At the date of observation
Value
Absolute change
Change from previous value
jan 1, 1992
5.711 trl
+5.711 trl
0.0%
jan 1, 1993
6.798 trl
+1.086 trl
19.02%
jan 1, 1994
8.273 trl
+1.475 trl
21.71%
jan 1, 1995
10.216 trl
+1.943 trl
23.48%
jan 1, 1996
11.318 trl
+1.102 trl
10.78%
jan 1, 1997
13.247 trl
+1.929 trl
17.05%
jan 1, 1998
14.301 trl
+1.053 trl
7.95%
jan 1, 1999
15.327 trl
+1.026 trl
7.17%
jan 1, 2000
16.667 trl
+1.341 trl
8.75%
jan 1, 2001
18.477 trl
+1.81 trl
10.86%
jan 1, 2002
20.298 trl
+1.821 trl
9.86%
jan 1, 2003
21.1 trl
+802.051 bln
3.95%
jan 1, 2004
24.969 trl
+3.869 trl
18.33%
jan 1, 2005
29.567 trl
+4.598 trl
18.42%
jan 1, 2006
33.185 trl
+3.618 trl
12.24%
jan 1, 2007
38.04 trl
+4.855 trl
14.63%
jan 1, 2008
45.249 trl
+7.209 trl
18.95%
jan 1, 2009
56.674 trl
+11.425 trl
25.25%
jan 1, 2010
54.189 trl
-2.485 trl
-4.39%
jan 1, 2011
66.222 trl
+12.033 trl
22.21%
jan 1, 2012
73.739 trl
+7.518 trl
11.35%
jan 1, 2013
77.333 trl
+3.593 trl
4.87%
jan 1, 2014
84.587 trl
+7.254 trl
9.38%
jan 1, 2015
95.255 trl
+10.668 trl
12.61%
jan 1, 2016
97.698 trl
+2.443 trl
2.57%
Ranking of countries by current statistics by years


Comments: