30
/
AIzaSyAYiBZKx7MnpbEhh9jyipgxe19OcubqV5w
April 1, 2024
64543
Albania
ALB
true
2
1
Disbursements on external debt, private nonguaranteed (PNG) (DIS, current US$)
2016,2015,2014,2013,2012,2011,2010,2009,2008,2007,2006,2005,2003,2000
Public Timelines
FAQ
Menu
Public Timelines
FAQ
Public Timelines
FAQ
For education
For educational institutions
For teachers
For students
Open cabinet
For educational institutions
For teachers
For students
Open cabinet
Create
Close
Create a timeline
Public timelines
Library
FAQ
Download
Global statistics library
→
Albania
→
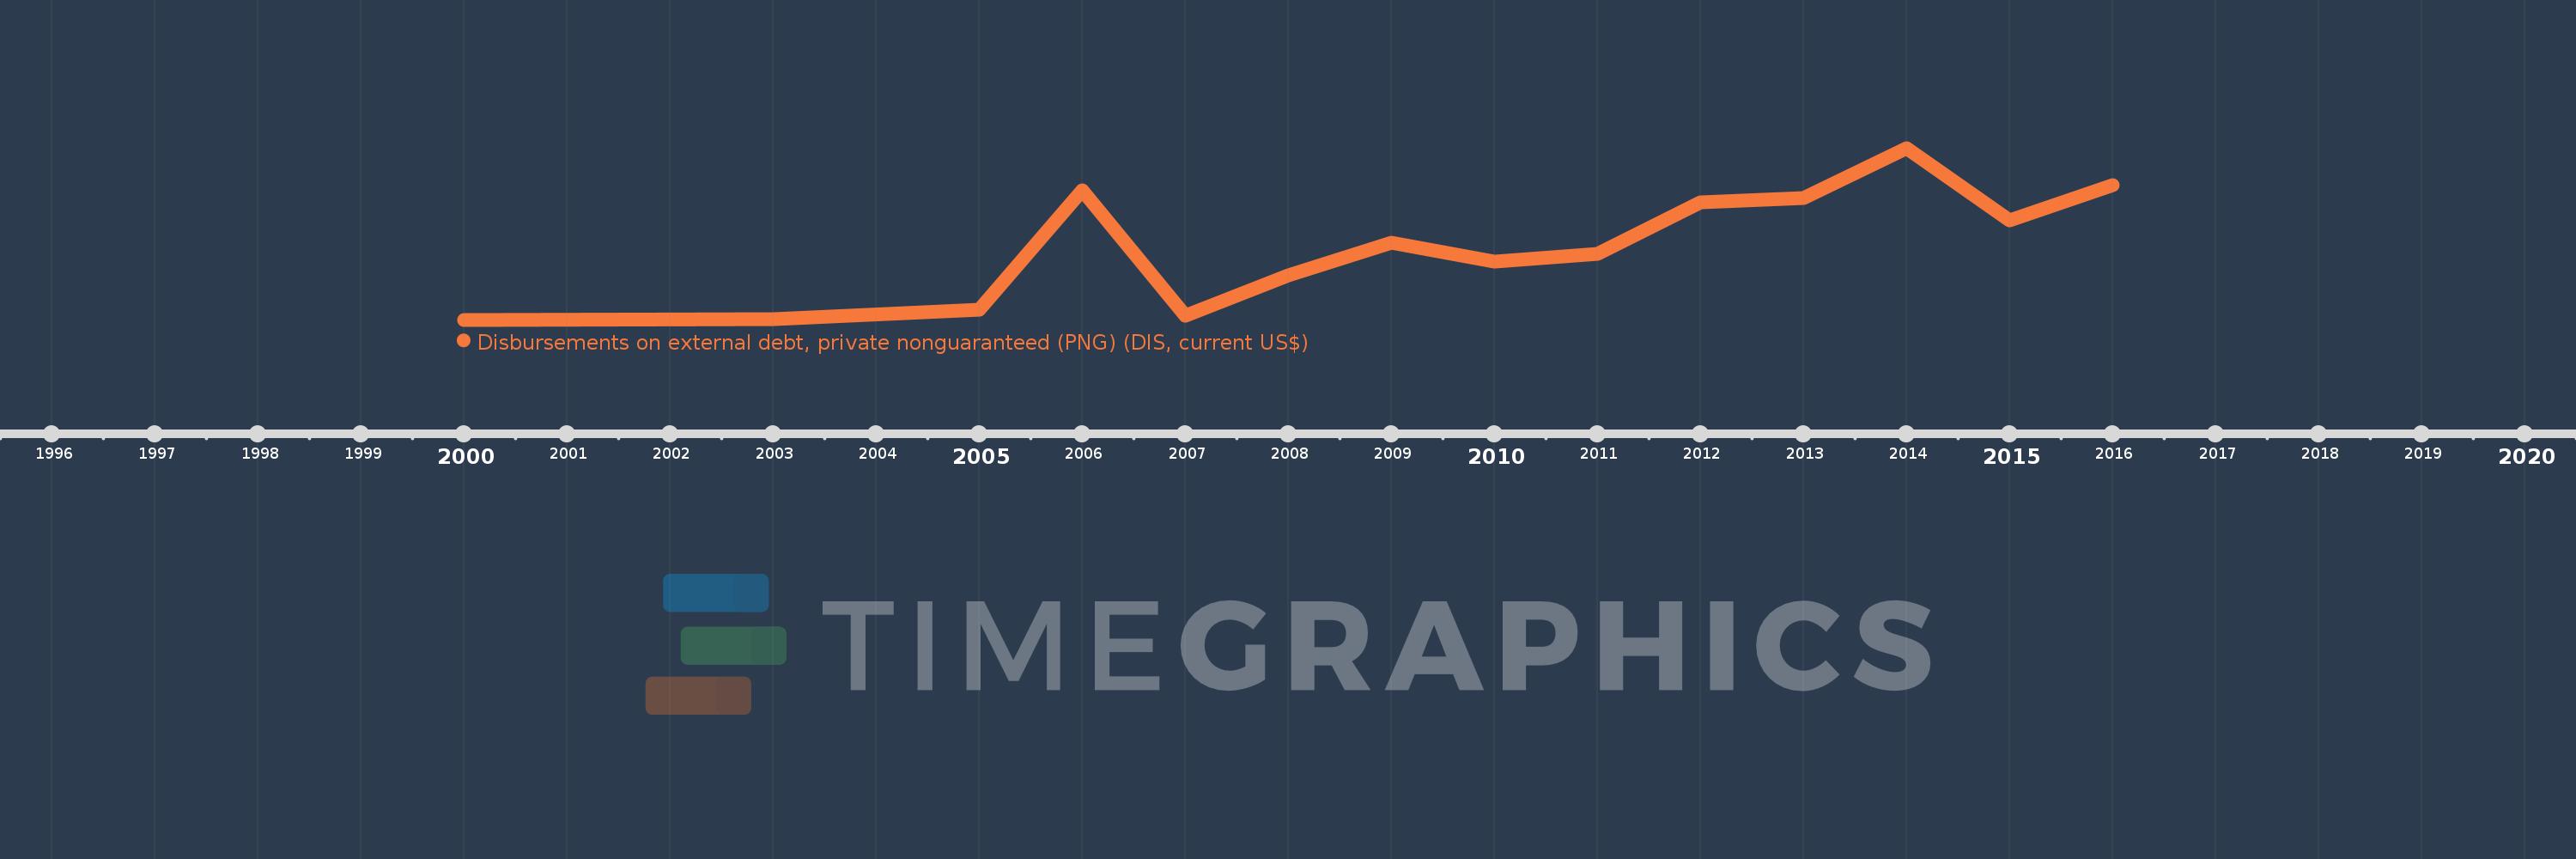
Disbursements on external debt, private nonguaranteed (PNG) (DIS, current US$)
This statistics in other country:
Albania
Algeria
Argentina
Armenia
Azerbaijan
Bangladesh
Belarus
Belize
Bhutan
Bolivia
Bosnia and Herzegovina
Botswana
Brazil
Bulgaria
Cambodia
Cameroon
China
Colombia
Costa Rica
Cote d'Ivoire
Dominican Republic
East Asia & Pacific (excluding high income)
Ecuador
Egypt, Arab Rep.
El Salvador
Europe & Central Asia (excluding high income)
Fiji
Georgia
Ghana
Guatemala
Guyana
Haiti
Honduras
IDA only
India
Indonesia
Jamaica
Jordan
Kazakhstan
Kenya
Kosovo
Kyrgyz Republic
Lao PDR
Latin America & Caribbean (excluding high income)
Lebanon
Liberia
Low & middle income
Low income
Lower middle income
Macedonia, FYR
Madagascar
Malawi
Malaysia
Maldives
Mauritius
Mexico
Middle East & North Africa (excluding high income)
Middle income
Moldova
Mongolia
Montenegro
Morocco
Myanmar
Nicaragua
Niger
Nigeria
Pakistan
Panama
Papua New Guinea
Paraguay
Peru
Philippines
Romania
Russian Federation
Senegal
Serbia
Solomon Islands
South Africa
South Asia
Sri Lanka
Sub-Saharan Africa (excluding high income)
Tajikistan
Tanzania
Thailand
Tunisia
Turkey
Turkmenistan
Ukraine
Upper middle income
Uzbekistan
Venezuela, RB
Vietnam
Zambia
Zimbabwe
Timeline:
This timeline shows a graph from
2000
to
2016
of Albania. No data until
1999
. Number of actual observations by date:
14
.
Source name:
World Development Indicators
Source organization:
World Bank, International Debt Statistics.
Categories, topics:
External Debt
Last updated:
apr 23, 2017
Indicators value changes by year
Meaning:
211.583 mln
Minimum:
1000.0K
jan 1, 2000
Maximum:
490.829 mln
jan 1, 2014
At the date of observation
Value
Absolute change
Change from the previous value
jan 1, 2000
1000.0K
+1000.0K
0.0%
jan 1, 2003
3.147 mln
+2.147 mln
214.7%
jan 1, 2005
29.263 mln
+26.116 mln
829.87%
jan 1, 2006
370.045 mln
+340.782 mln
1.16K%
jan 1, 2007
12.301 mln
-357.744 mln
-96.68%
jan 1, 2008
126.558 mln
+114.257 mln
928.84%
jan 1, 2009
220.315 mln
+93.757 mln
74.08%
jan 1, 2010
166.812 mln
-53.503 mln
-24.28%
jan 1, 2011
188.789 mln
+21.977 mln
13.17%
jan 1, 2012
336.336 mln
+147.547 mln
78.15%
jan 1, 2013
347.046 mln
+10.71 mln
3.18%
jan 1, 2014
490.829 mln
+143.783 mln
41.43%
jan 1, 2015
284.635 mln
-206.194 mln
-42.01%
jan 1, 2016
385.085 mln
+100.45 mln
35.29%
Ranking of countries by current statistics by years
About & Feedback
Terms
Privacy
Library
2024
©
Time.Graphics
Support 24/7
Cabinet
Get premium
Donate
The service accepts bank transfer (ACH, Wire) or cards (Visa, MasterCard, etc). Processed by Stripe.
Secured with SSL
Excellent (Trustpilot Reviews)
Based on 115+ reviews
Write your own review on
Trustpilot.com
