29
/
en
AIzaSyAYiBZKx7MnpbEhh9jyipgxe19OcubqV5w
April 1, 2024
140229
Ghana
GHA
true
2
1
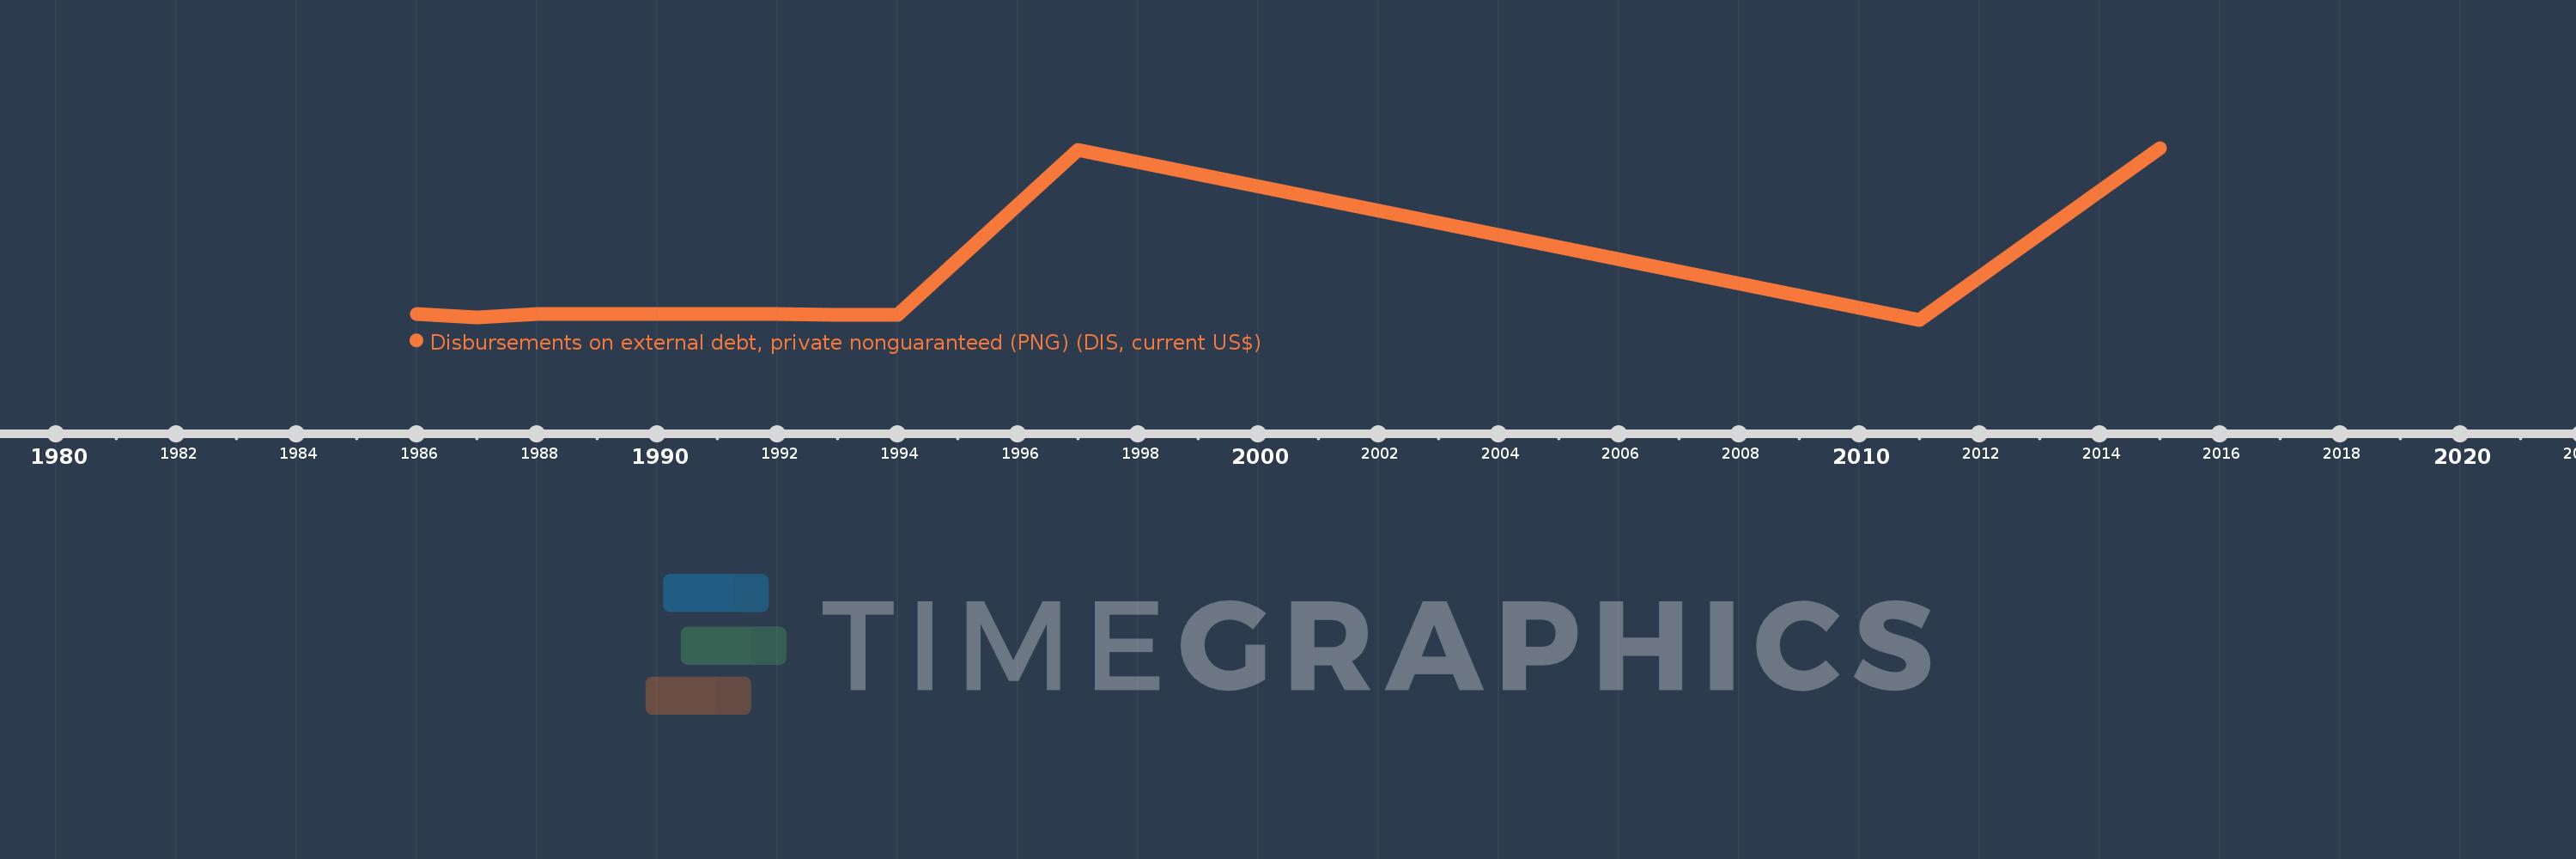
Disbursements on external debt, private nonguaranteed (PNG) (DIS, current US$)
2015,2011,1997,1994,1993,1992,1991,1990,1989,1988,1987,1986
This statistics in other country:
Timeline:
This timeline shows a graph from 1986 to 2015 of Ghana. No data until 1985. Number of actual observations by date: 12.
Source name:
World Development Indicators
Source organization:
World Bank, International Debt Statistics.
Categories, topics:
External Debt
Last updated:
apr 23, 2017
Indicators value changes by year
Maximum:
253.189 mln
jan 1, 2015
At the date of observation
Value
Absolute change
Change from previous value
jan 1, 1986
8.165 mln
+8.165 mln
0.0%
jan 1, 1987
3.6 mln
-4.565 mln
-55.91%
jan 1, 1988
7.9 mln
+4.3 mln
119.44%
jan 1, 1989
9.1 mln
+1.2 mln
15.19%
jan 1, 1990
9.0 mln
-100.0K
-1.1%
jan 1, 1991
8.0 mln
-1000.0K
-11.11%
jan 1, 1992
9.0 mln
+1000.0K
12.5%
jan 1, 1993
7.0 mln
-2.0 mln
-22.22%
jan 1, 1994
7.0 mln
0.0
0.0%
jan 1, 1997
250.0 mln
+243.0 mln
3.47K%
jan 1, 2011
0.0
-250.0 mln
-100.0%
jan 1, 2015
253.189 mln
+253.189 mln
%
Ranking of countries by current statistics by years


Comments: