29
/
en
AIzaSyAYiBZKx7MnpbEhh9jyipgxe19OcubqV5w
April 1, 2024
164681
Jordan
JOR
true
2
1
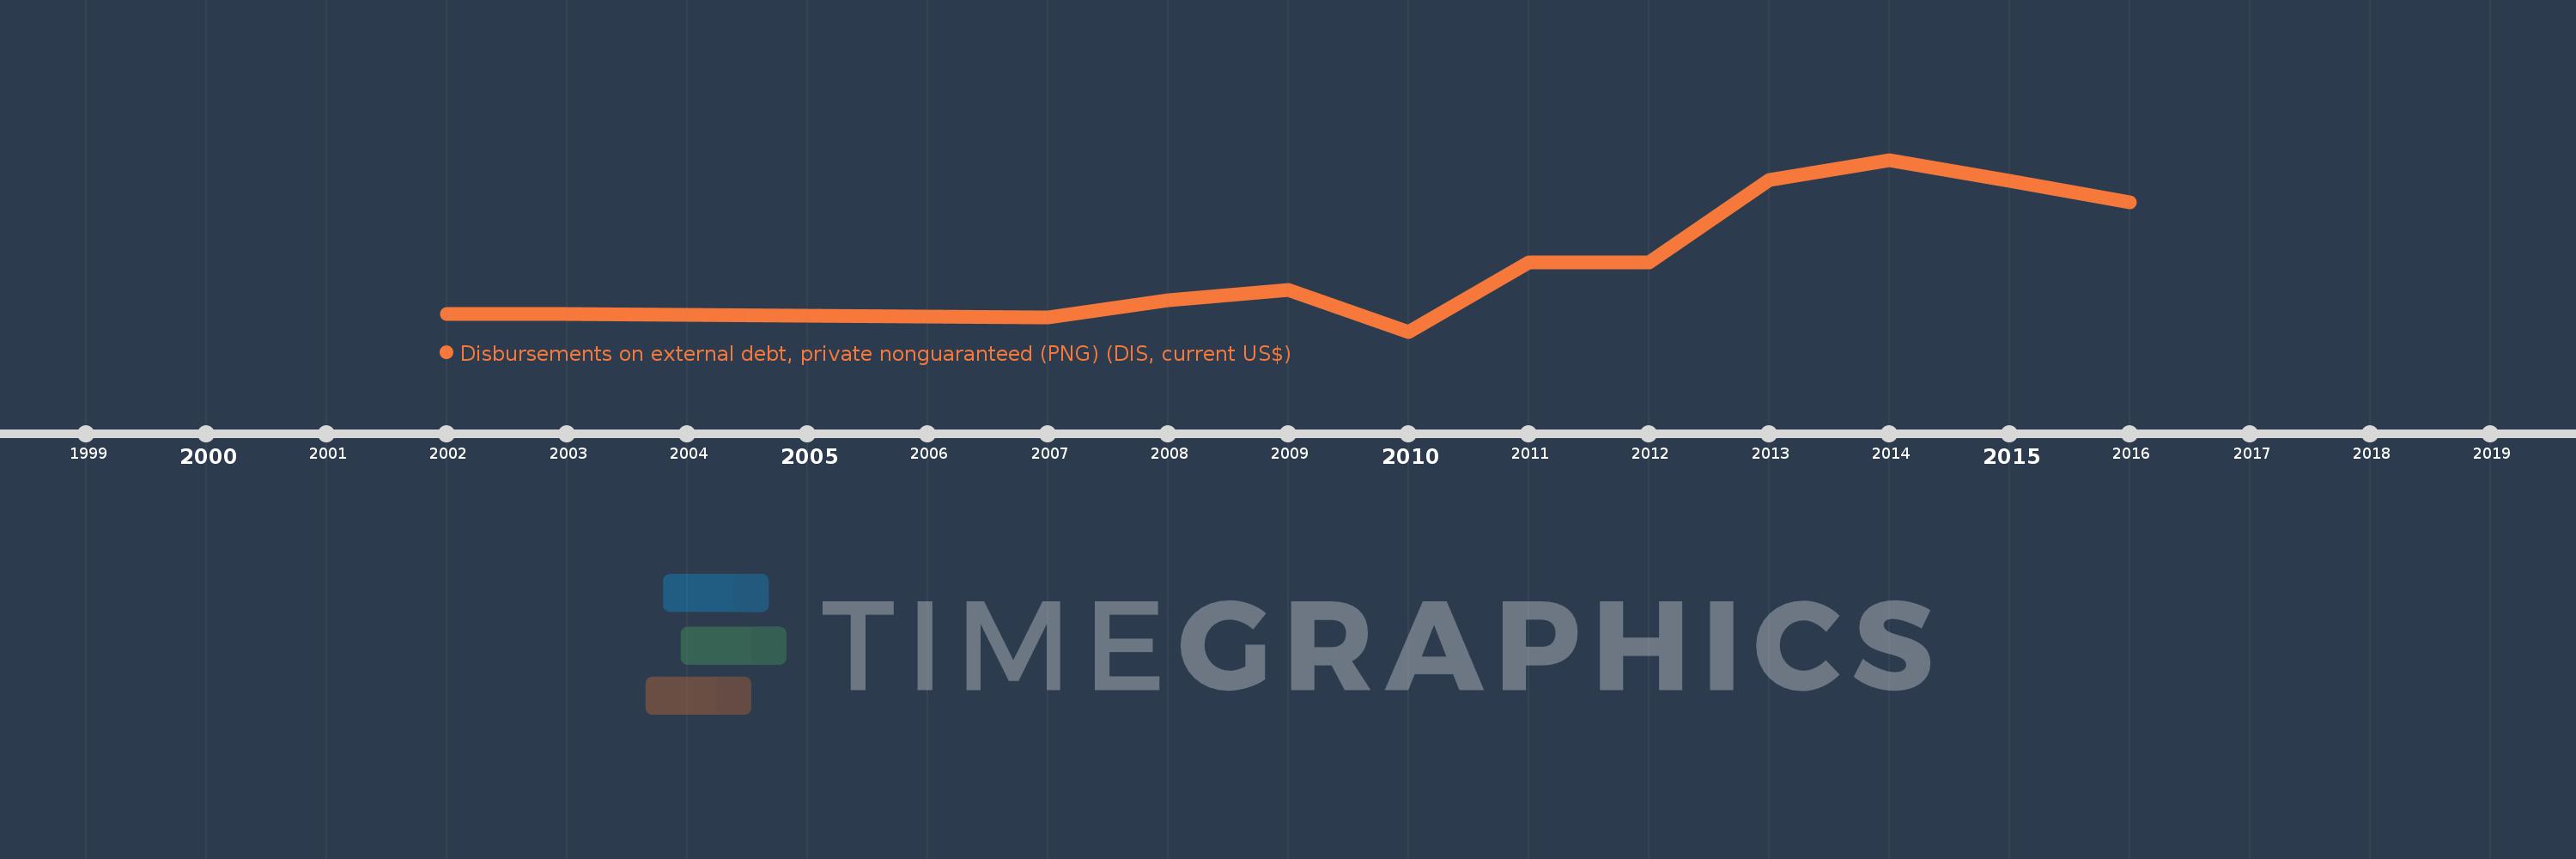
Disbursements on external debt, private nonguaranteed (PNG) (DIS, current US$)
2016,2015,2014,2013,2012,2011,2010,2009,2008,2007,2003,2002
This statistics in other country:
Timeline:
This timeline shows a graph from 2002 to 2016 of Jordan. No data until 2001. Number of actual observations by date: 12.
Source name:
World Development Indicators
Source organization:
World Bank, International Debt Statistics.
Categories, topics:
External Debt
Last updated:
apr 23, 2017
Indicators value changes by year
Minimum:
25.0 mln
jan 1, 2010
Maximum:
335.5 mln
jan 1, 2014
At the date of observation
Value
Absolute change
Change from previous value
jan 1, 2002
56.597 mln
+56.597 mln
0.0%
jan 1, 2003
56.597 mln
0.0
0.0%
jan 1, 2007
50.0 mln
-6.597 mln
-11.66%
jan 1, 2008
82.0 mln
+32.0 mln
64.0%
jan 1, 2009
100.0 mln
+18.0 mln
21.95%
jan 1, 2010
25.0 mln
-75.0 mln
-75.0%
jan 1, 2011
150.0 mln
+125.0 mln
500.0%
jan 1, 2012
150.0 mln
0.0
0.0%
jan 1, 2013
298.789 mln
+148.789 mln
99.19%
jan 1, 2014
335.5 mln
+36.711 mln
12.29%
jan 1, 2015
297.196 mln
-38.304 mln
-11.42%
jan 1, 2016
258.428 mln
-38.768 mln
-13.04%
Ranking of countries by current statistics by years


Comments: