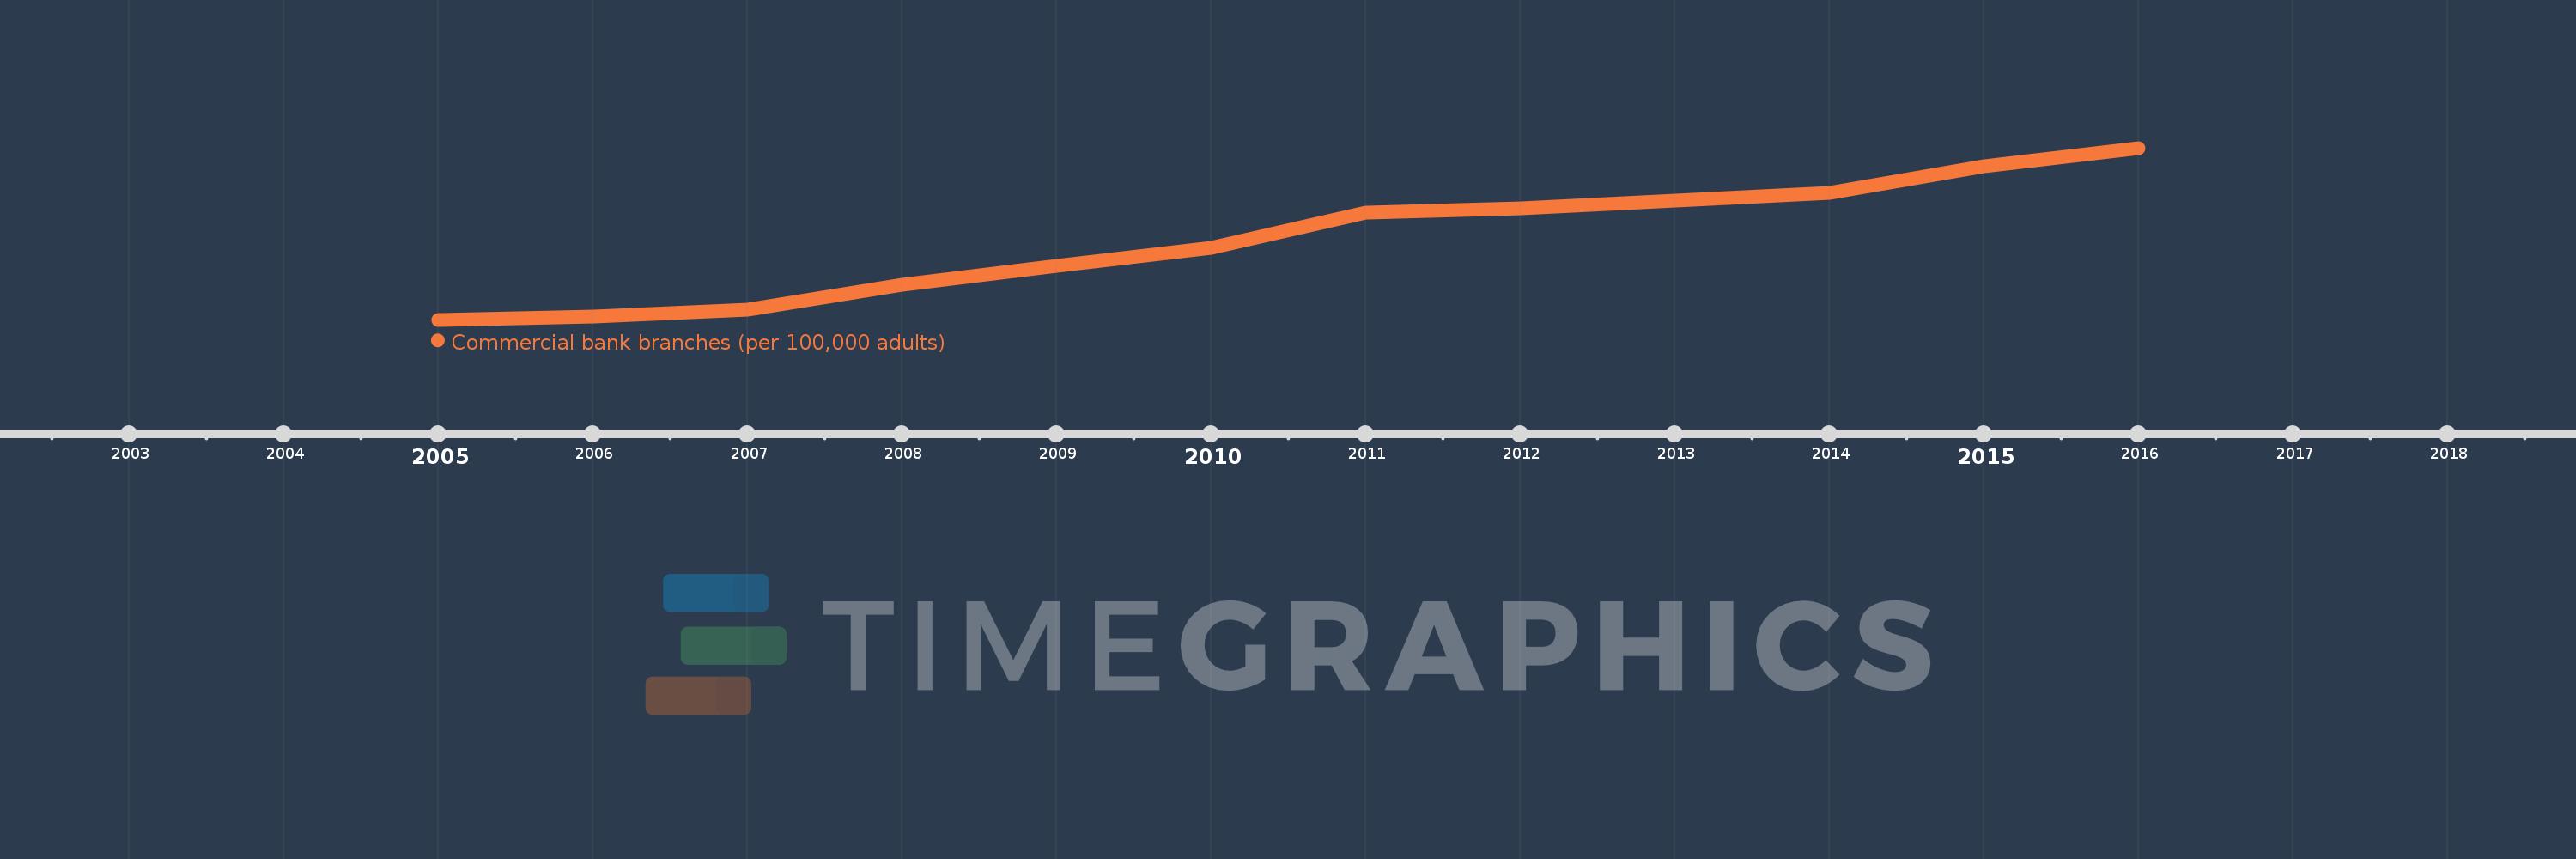
This timeline shows a graph from 2005 to 2016 of Sub-Saharan Africa (IDA & IBRD countries). No data until 2004. Number of actual observations by date: 12.
Source name:
World Development Indicators
Source organization:
International Monetary Fund, Financial Access Survey.
Categories, topics:
Financial Sector
Last updated:
apr 23, 2017
Indicators value changes by year
Meaning:
2.925
Minimum:
1.422
jan 1, 2005
Maximum:
4.642
jan 1, 2016
At the date of observation
Value
Absolute change
Change from the previous value
jan 1, 2005
1.422
+1.422
0.0%
jan 1, 2006
1.478
+0.056
3.95%
jan 1, 2007
1.605
+0.127
8.6%
jan 1, 2008
2.074
+0.469
29.22%
jan 1, 2009
2.428
+0.354
17.08%
jan 1, 2010
2.766
+0.337
13.9%
jan 1, 2011
3.432
+0.667
24.1%
jan 1, 2012
3.508
+0.075
2.19%
jan 1, 2013
3.649
+0.141
4.02%
jan 1, 2014
3.792
+0.143
3.93%
jan 1, 2015
4.299
+0.507
13.38%
jan 1, 2016
4.642
+0.342
7.96%
Ranking of countries by current statistics by years
