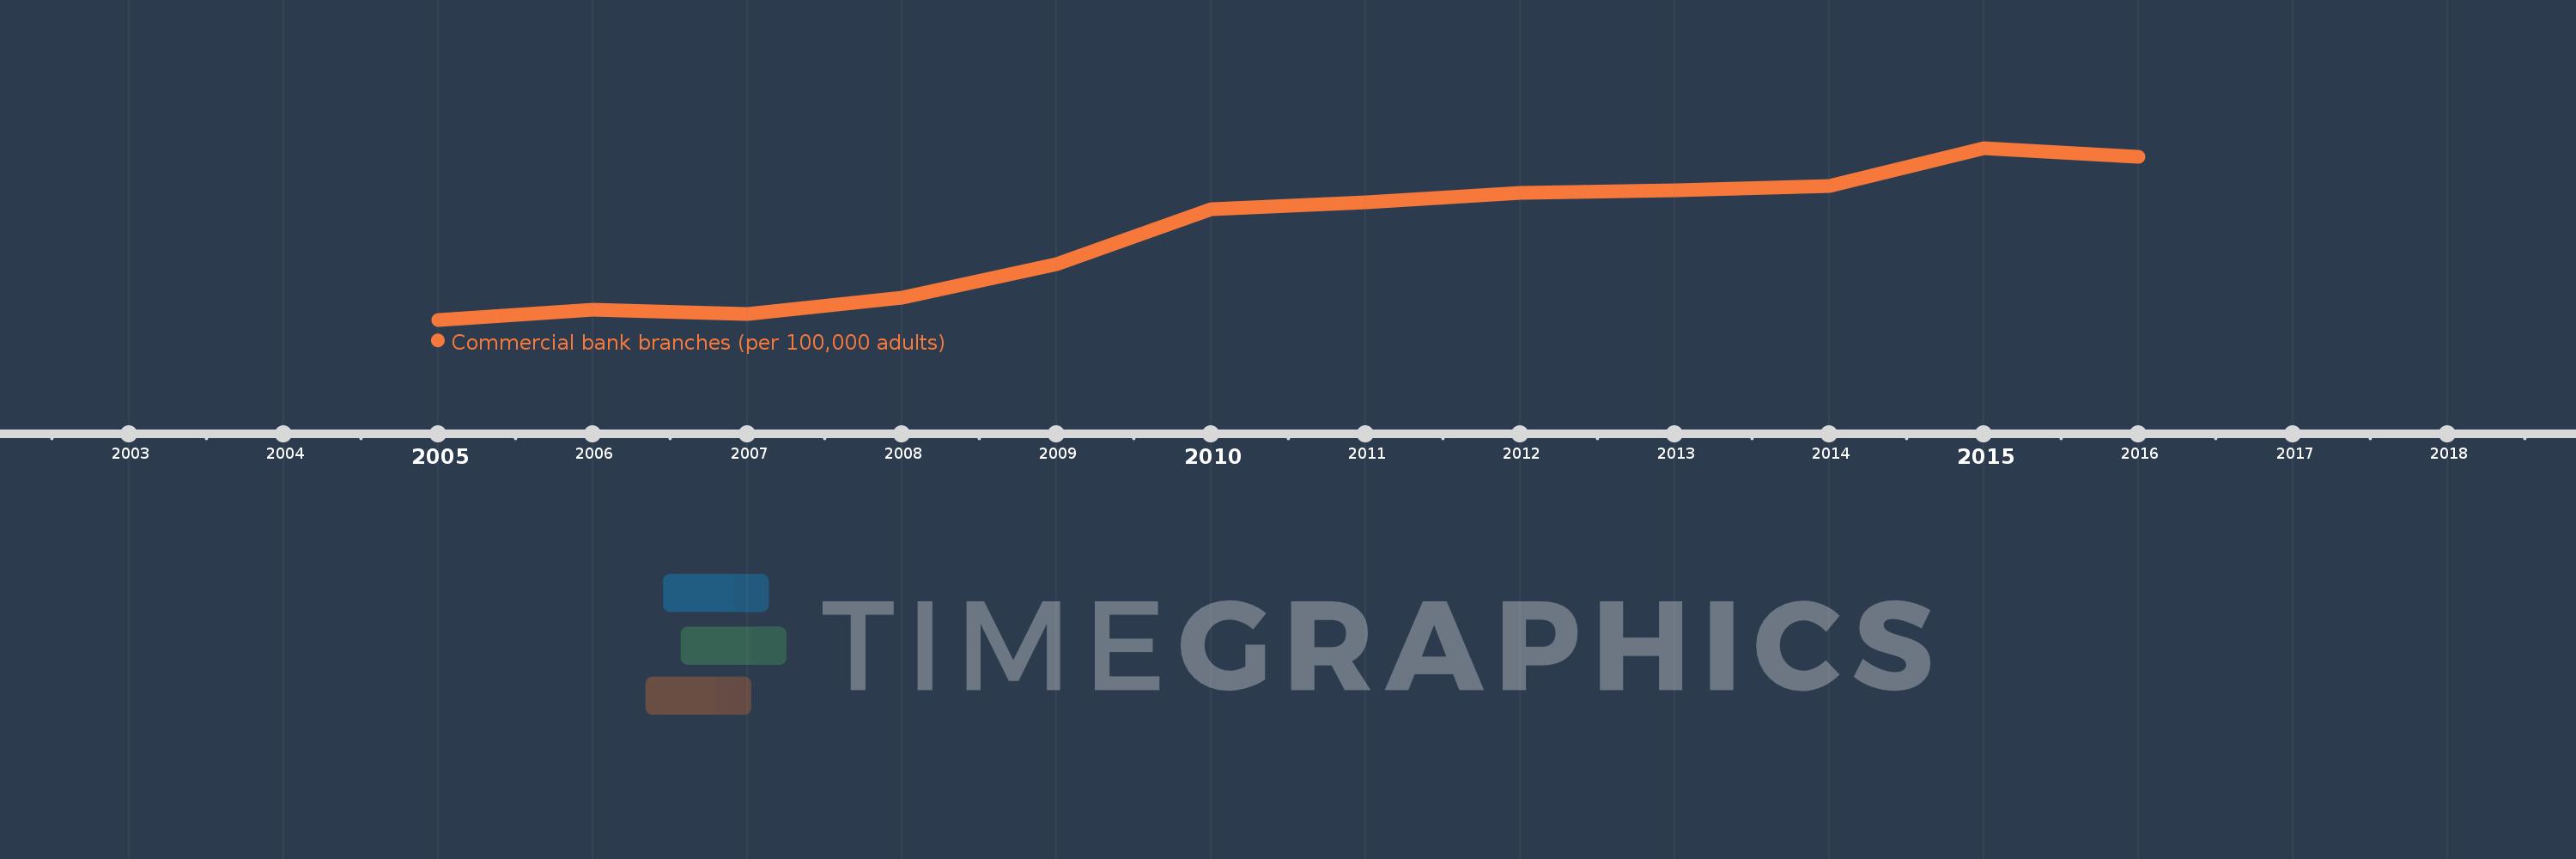
This timeline shows a graph from 2005 to 2016 of Fragile and conflict affected situations. No data until 2004. Number of actual observations by date: 12.
Source name:
World Development Indicators
Source organization:
International Monetary Fund, Financial Access Survey.
Categories, topics:
Financial Sector
Last updated:
apr 23, 2017
Indicators value changes by year
Meaning:
2.543
Minimum:
1.757
jan 1, 2005
Maximum:
3.306
jan 1, 2015
At the date of observation
Value
Absolute change
Change from the previous value
jan 1, 2005
1.757
+1.757
0.0%
jan 1, 2006
1.844
+0.087
4.92%
jan 1, 2007
1.809
-0.034
-1.87%
jan 1, 2008
1.958
+0.148
8.2%
jan 1, 2009
2.257
+0.299
15.26%
jan 1, 2010
2.751
+0.494
21.89%
jan 1, 2011
2.816
+0.065
2.37%
jan 1, 2012
2.9
+0.085
3.01%
jan 1, 2013
2.926
+0.026
0.9%
jan 1, 2014
2.966
+0.039
1.34%
jan 1, 2015
3.306
+0.34
11.48%
jan 1, 2016
3.223
-0.084
-2.53%
Ranking of countries by current statistics by years
