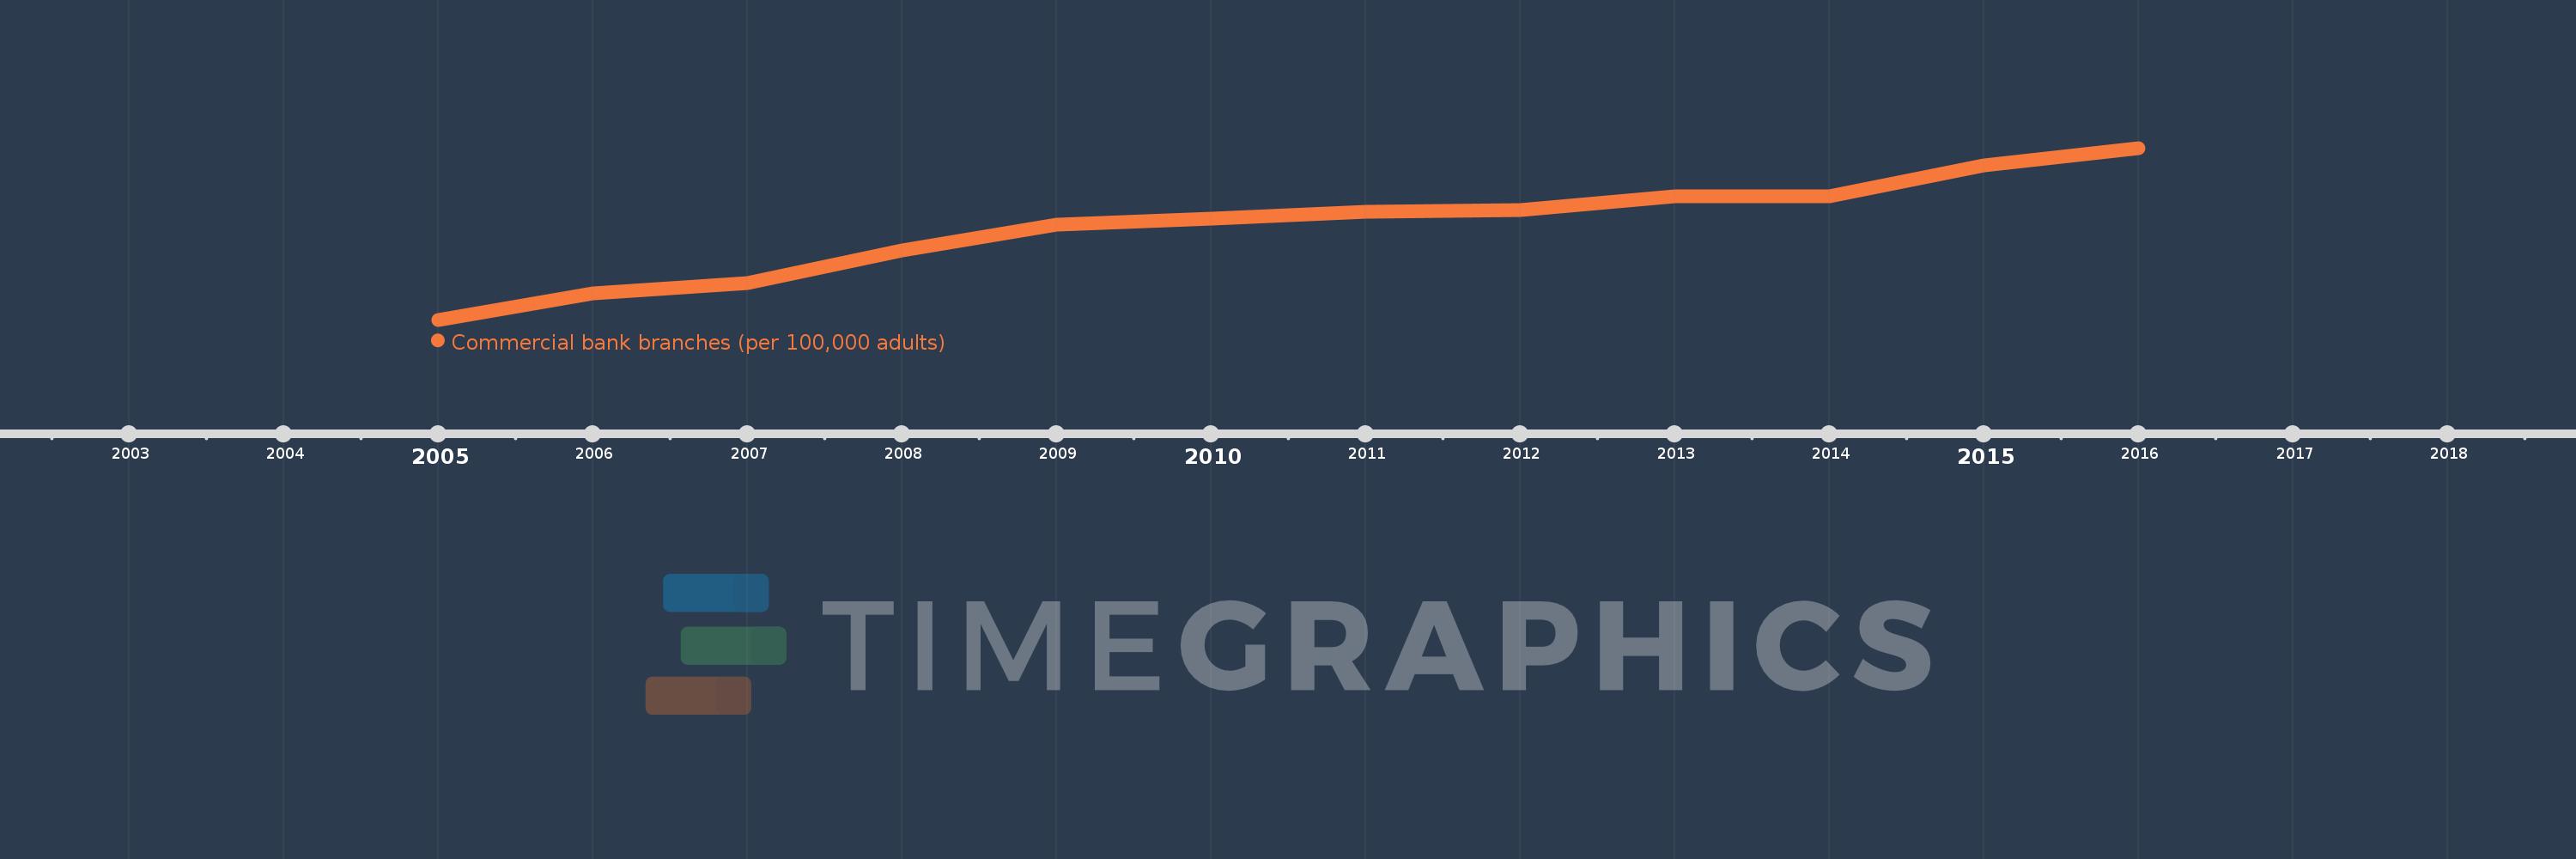
This timeline shows a graph from 2005 to 2016 of Latin America & Caribbean (excluding high income). No data until 2004. Number of actual observations by date: 12.
Source name:
World Development Indicators
Source organization:
International Monetary Fund, Financial Access Survey.
Categories, topics:
Financial Sector
Last updated:
apr 23, 2017
Indicators value changes by year
Meaning:
13.029
Minimum:
9.943
jan 1, 2005
Maximum:
15.624
jan 1, 2016
At the date of observation
Value
Absolute change
Change from the previous value
jan 1, 2005
9.943
+9.943
0.0%
jan 1, 2006
10.815
+0.873
8.78%
jan 1, 2007
11.15
+0.334
3.09%
jan 1, 2008
12.248
+1.098
9.85%
jan 1, 2009
13.1
+0.852
6.96%
jan 1, 2010
13.296
+0.196
1.5%
jan 1, 2011
13.501
+0.205
1.54%
jan 1, 2012
13.562
+0.061
0.45%
jan 1, 2013
14.034
+0.472
3.48%
jan 1, 2014
14.017
-0.016
-0.12%
jan 1, 2015
15.054
+1.036
7.39%
jan 1, 2016
15.624
+0.57
3.79%
Ranking of countries by current statistics by years
