30
/
AIzaSyAYiBZKx7MnpbEhh9jyipgxe19OcubqV5w
April 1, 2024
57459
South Asia
SAS
false
2
1
PNG, bonds (AMT, current US$)
2016,2015,2014,2013,2012,2011,2010,2009,2008,2007,2006,2005,2004,2003,2002,2001,2000,1999,1998
Public Timelines
FAQ
Menu
Public Timelines
FAQ
Public Timelines
FAQ
For education
For educational institutions
For teachers
For students
Open cabinet
For educational institutions
For teachers
For students
Open cabinet
Create
Close
Create a timeline
Public timelines
Library
FAQ
Download
Global statistics library
→
South Asia
→
PNG, bonds (AMT, current US$)
This statistics in other country:
Argentina
Botswana
Brazil
Bulgaria
China
Colombia
Dominican Republic
East Asia & Pacific (excluding high income)
Ecuador
Egypt, Arab Rep.
Europe & Central Asia (excluding high income)
Ghana
Guatemala
IDA only
India
Indonesia
Jamaica
Kazakhstan
Latin America & Caribbean (excluding high income)
Lebanon
Low & middle income
Lower middle income
Malaysia
Mexico
Middle East & North Africa (excluding high income)
Middle income
Mongolia
Pakistan
Panama
Peru
Philippines
Romania
Russian Federation
Serbia
South Africa
South Asia
Sri Lanka
Sub-Saharan Africa (excluding high income)
Thailand
Turkey
Ukraine
Upper middle income
Venezuela, RB
Timeline:
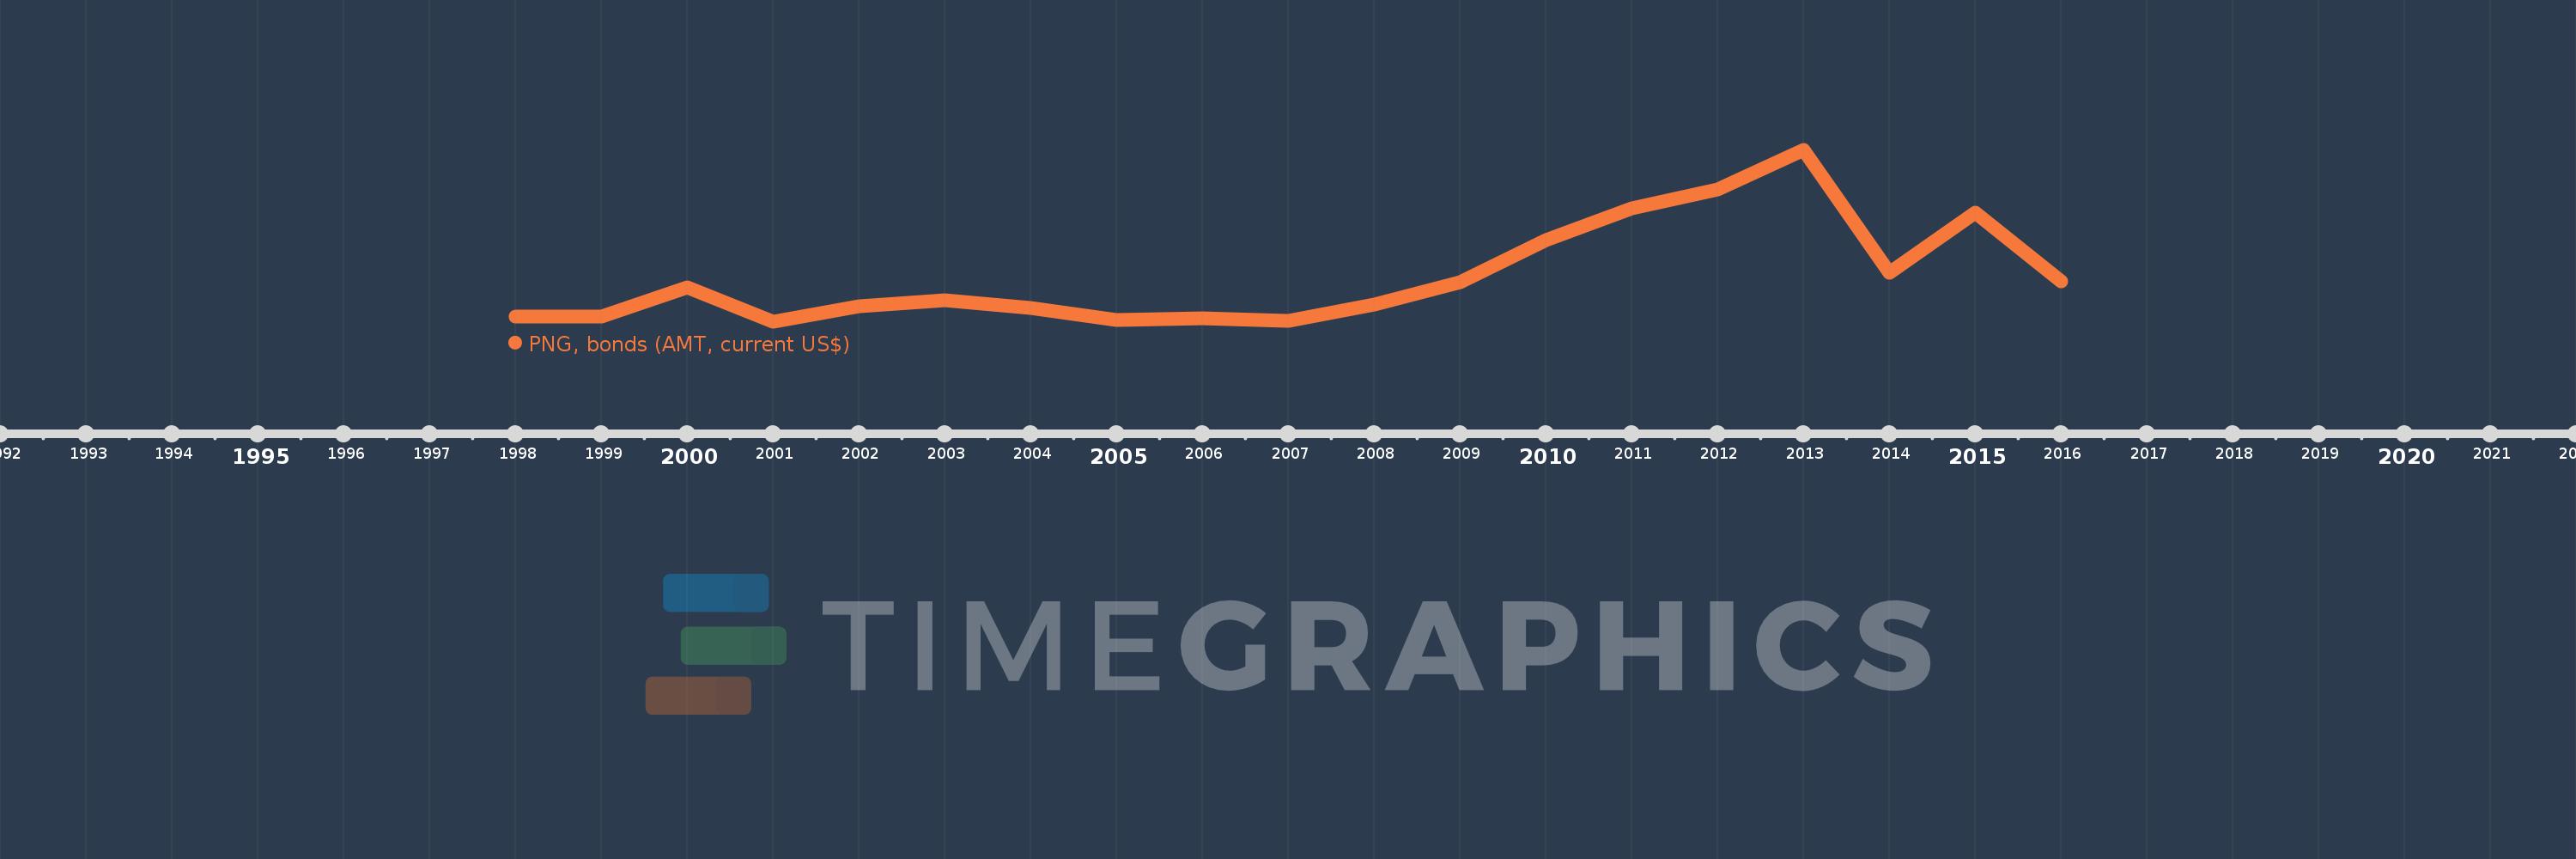
This timeline shows a graph from
1998
to
2016
of South Asia. No data until
1997
. Number of actual observations by date:
19
.
Source name:
World Development Indicators
Source organization:
World Bank, International Debt Statistics.
Categories, topics:
External Debt
Last updated:
apr 23, 2017
Indicators value changes by year
Meaning:
994.951 mln
Minimum:
35.0 mln
jan 1, 2001
Maximum:
3.678 bln
jan 1, 2013
At the date of observation
Value
Absolute change
Change from the previous value
jan 1, 1998
150.0 mln
+150.0 mln
0.0%
jan 1, 1999
149.21 mln
-790.0K
-0.53%
jan 1, 2000
764.994 mln
+615.784 mln
412.7%
jan 1, 2001
35.0 mln
-729.994 mln
-95.42%
jan 1, 2002
360.949 mln
+325.949 mln
931.28%
jan 1, 2003
490.295 mln
+129.346 mln
35.83%
jan 1, 2004
332.272 mln
-158.023 mln
-32.23%
jan 1, 2005
83.134 mln
-249.138 mln
-74.98%
jan 1, 2006
117.296 mln
+34.162 mln
41.09%
jan 1, 2007
56.978 mln
-60.318 mln
-51.42%
jan 1, 2008
409.196 mln
+352.218 mln
618.16%
jan 1, 2009
879.549 mln
+470.353 mln
114.95%
jan 1, 2010
1.779 bln
+899.479 mln
102.27%
jan 1, 2011
2.451 bln
+672.242 mln
37.79%
jan 1, 2012
2.847 bln
+395.517 mln
16.14%
jan 1, 2013
3.678 bln
+831.213 mln
29.2%
jan 1, 2014
1.083 bln
-2.595 bln
-70.56%
jan 1, 2015
2.347 bln
+1.265 bln
116.82%
jan 1, 2016
890.107 mln
-1.457 bln
-62.08%
Ranking of countries by current statistics by years
About & Feedback
Terms
Privacy
Library
2024
©
Time.Graphics
Support 24/7
Cabinet
Get premium
Donate
The service accepts bank transfer (ACH, Wire) or cards (Visa, MasterCard, etc). Processed by Stripe.
Secured with SSL
Excellent (Trustpilot Reviews)
Based on 115+ reviews
Write your own review on
Trustpilot.com
