29
/
en
AIzaSyAYiBZKx7MnpbEhh9jyipgxe19OcubqV5w
April 1, 2024
106424
China
CHN
true
2
1
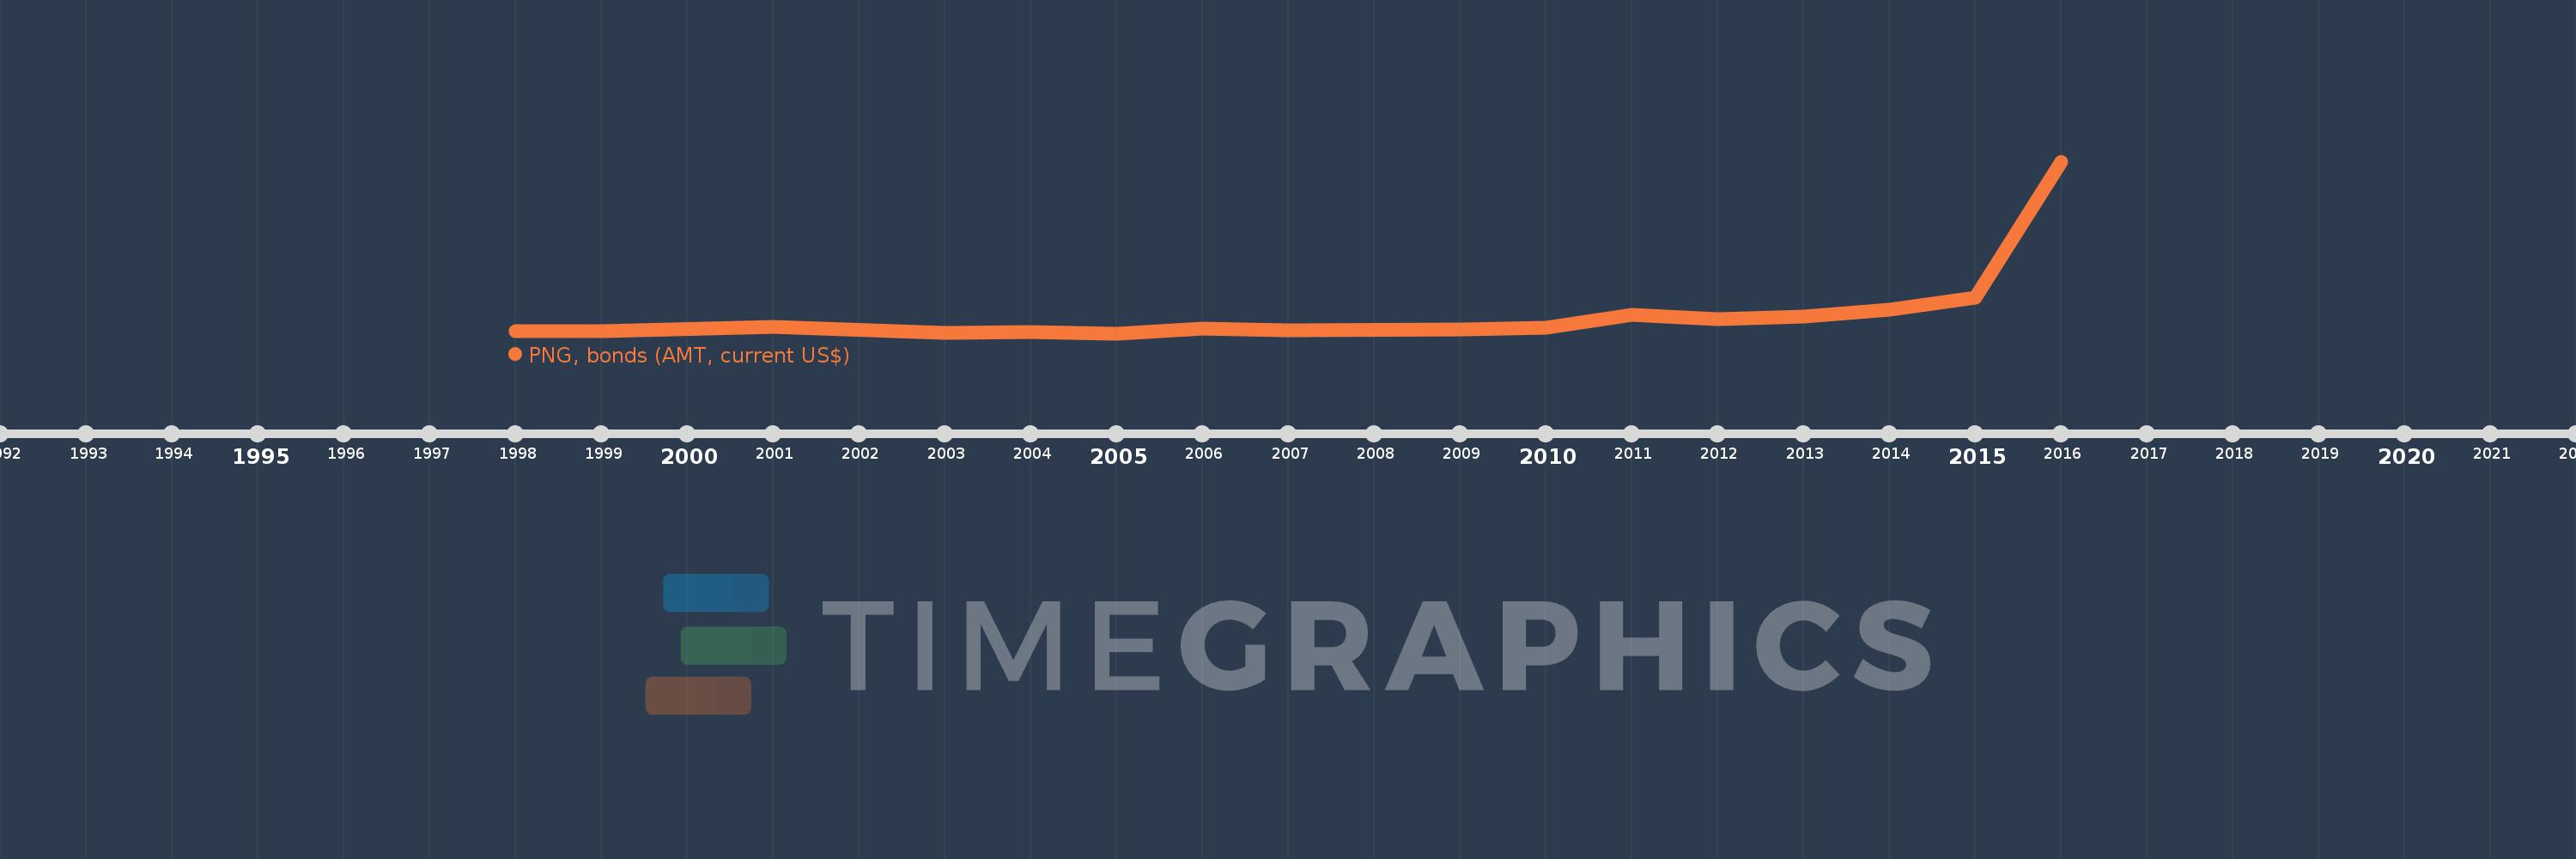
PNG, bonds (AMT, current US$)
2016,2015,2014,2013,2012,2011,2010,2009,2007,2006,2005,2004,2003,2001,1999,1998
This statistics in other country:
Timeline:
This timeline shows a graph from 1998 to 2016 of China. No data until 1997. Number of actual observations by date: 16.
Source name:
World Development Indicators
Source organization:
World Bank, International Debt Statistics.
Categories, topics:
External Debt
Last updated:
apr 23, 2017
Indicators value changes by year
Minimum:
25.698 mln
jan 1, 2005
Maximum:
13.208 bln
jan 1, 2016
At the date of observation
Value
Absolute change
Change from previous value
jan 1, 1998
206.93 mln
+206.93 mln
0.0%
jan 1, 1999
207.0 mln
+70.0K
0.03%
jan 1, 2001
533.633 mln
+326.633 mln
157.79%
jan 1, 2003
79.783 mln
-453.85 mln
-85.05%
jan 1, 2004
110.0 mln
+30.217 mln
37.87%
jan 1, 2005
25.698 mln
-84.302 mln
-76.64%
jan 1, 2006
370.0 mln
+344.302 mln
1.34K%
jan 1, 2007
239.528 mln
-130.472 mln
-35.26%
jan 1, 2009
350.0 mln
+110.472 mln
46.12%
jan 1, 2010
463.801 mln
+113.801 mln
32.51%
jan 1, 2011
1.459 bln
+995.525 mln
214.64%
jan 1, 2012
1.083 bln
-376.326 mln
-25.79%
jan 1, 2013
1.31 bln
+227.0 mln
20.96%
jan 1, 2014
1.821 bln
+510.721 mln
38.99%
jan 1, 2015
2.754 bln
+932.979 mln
51.24%
jan 1, 2016
13.208 bln
+10.454 bln
379.65%
Ranking of countries by current statistics by years


Comments: