29
/
en
AIzaSyAYiBZKx7MnpbEhh9jyipgxe19OcubqV5w
April 1, 2024
94028
Bulgaria
BGR
true
2
1
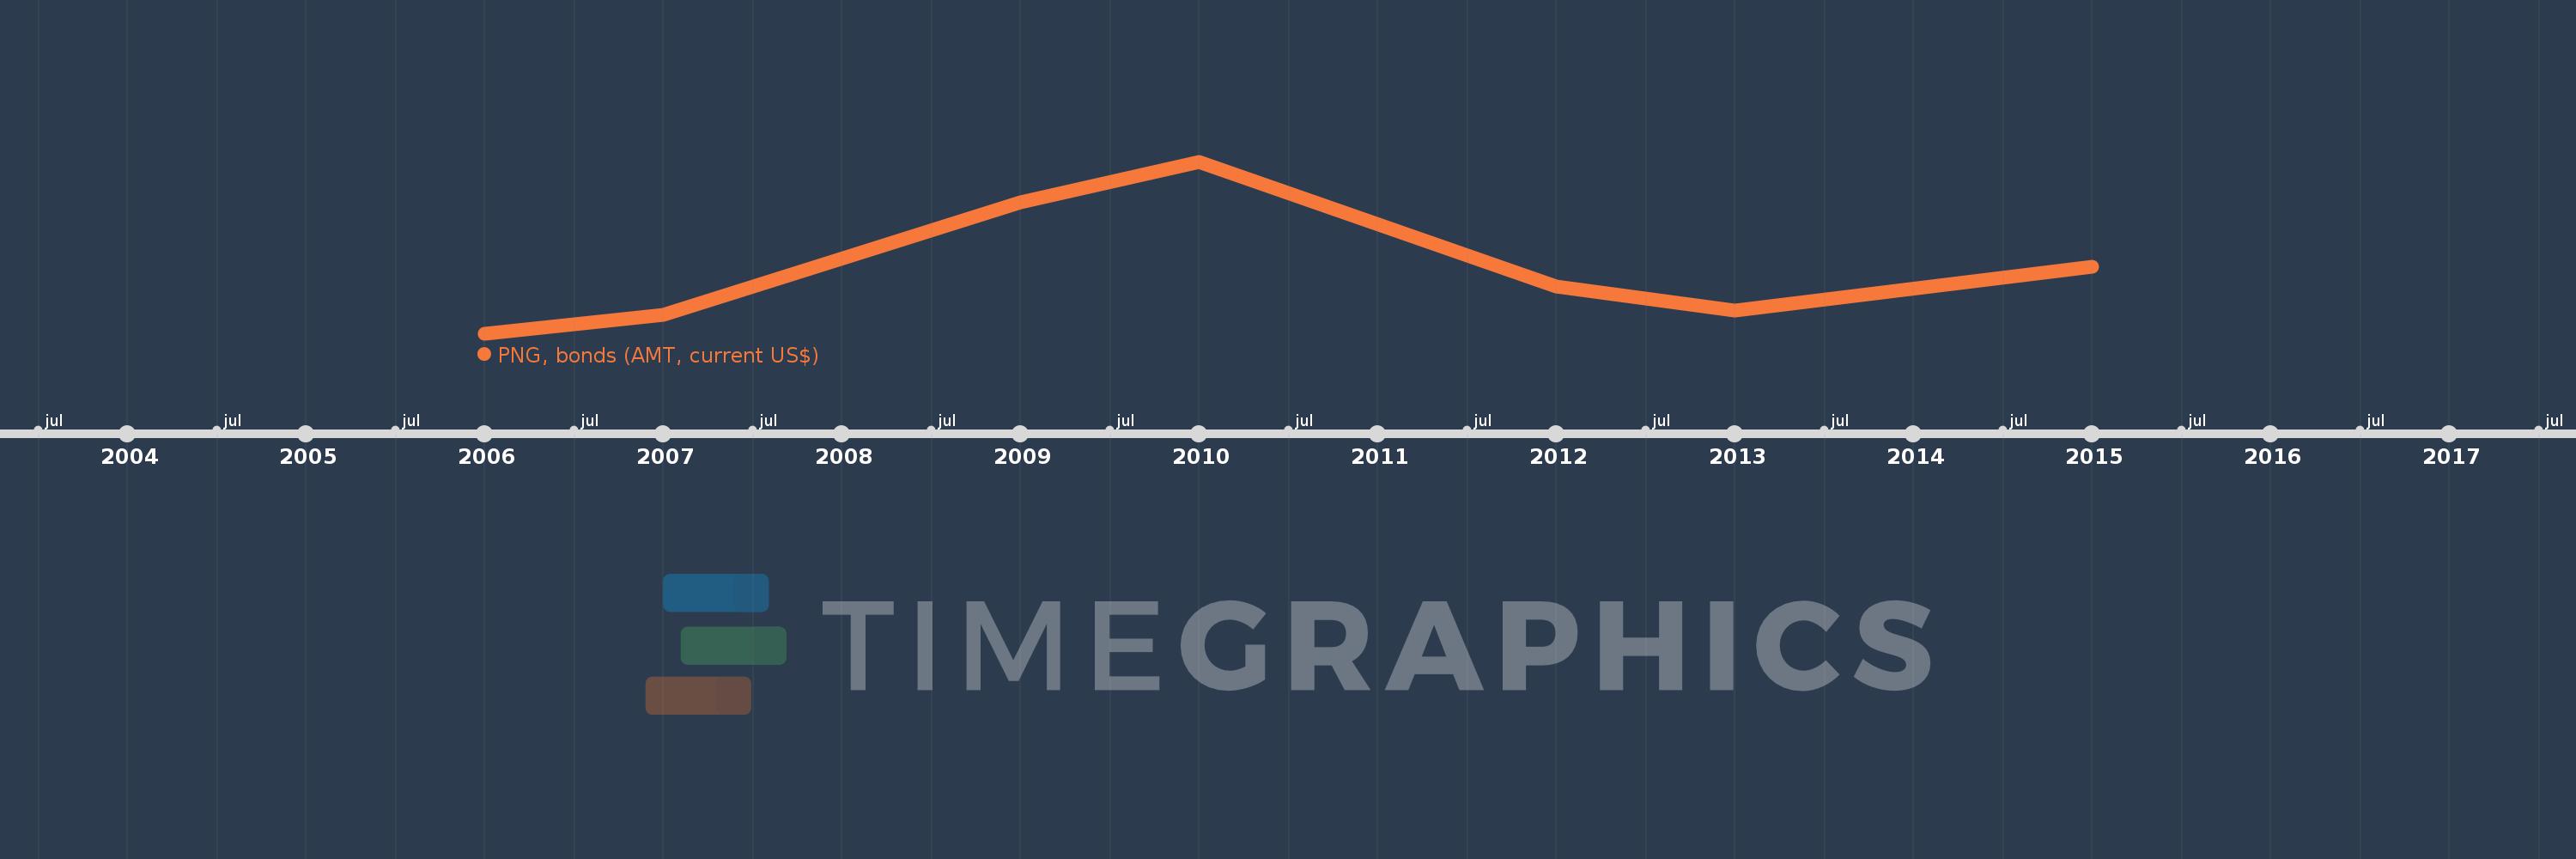
PNG, bonds (AMT, current US$)
2015,2013,2012,2010,2009,2007,2006
This statistics in other country:
Timeline:
This timeline shows a graph from 2006 to 2015 of Bulgaria. No data until 2005. Number of actual observations by date: 7.
Source name:
World Development Indicators
Source organization:
World Bank, International Debt Statistics.
Categories, topics:
External Debt
Last updated:
apr 23, 2017
Indicators value changes by year
Minimum:
10.0 mln
jan 1, 2006
Maximum:
372.317 mln
jan 1, 2010
At the date of observation
Value
Absolute change
Change from previous value
jan 1, 2006
10.0 mln
+10.0 mln
0.0%
jan 1, 2007
49.21 mln
+39.21 mln
392.1%
jan 1, 2009
286.69 mln
+237.48 mln
482.58%
jan 1, 2010
372.317 mln
+85.627 mln
29.87%
jan 1, 2012
109.141 mln
-263.176 mln
-70.69%
jan 1, 2013
57.478 mln
-51.663 mln
-47.34%
jan 1, 2015
150.0 mln
+92.522 mln
160.97%
Ranking of countries by current statistics by years


Comments: