29
/
en
AIzaSyAYiBZKx7MnpbEhh9jyipgxe19OcubqV5w
April 1, 2024
55897
Pre-demographic dividend
PRE
false
2
1
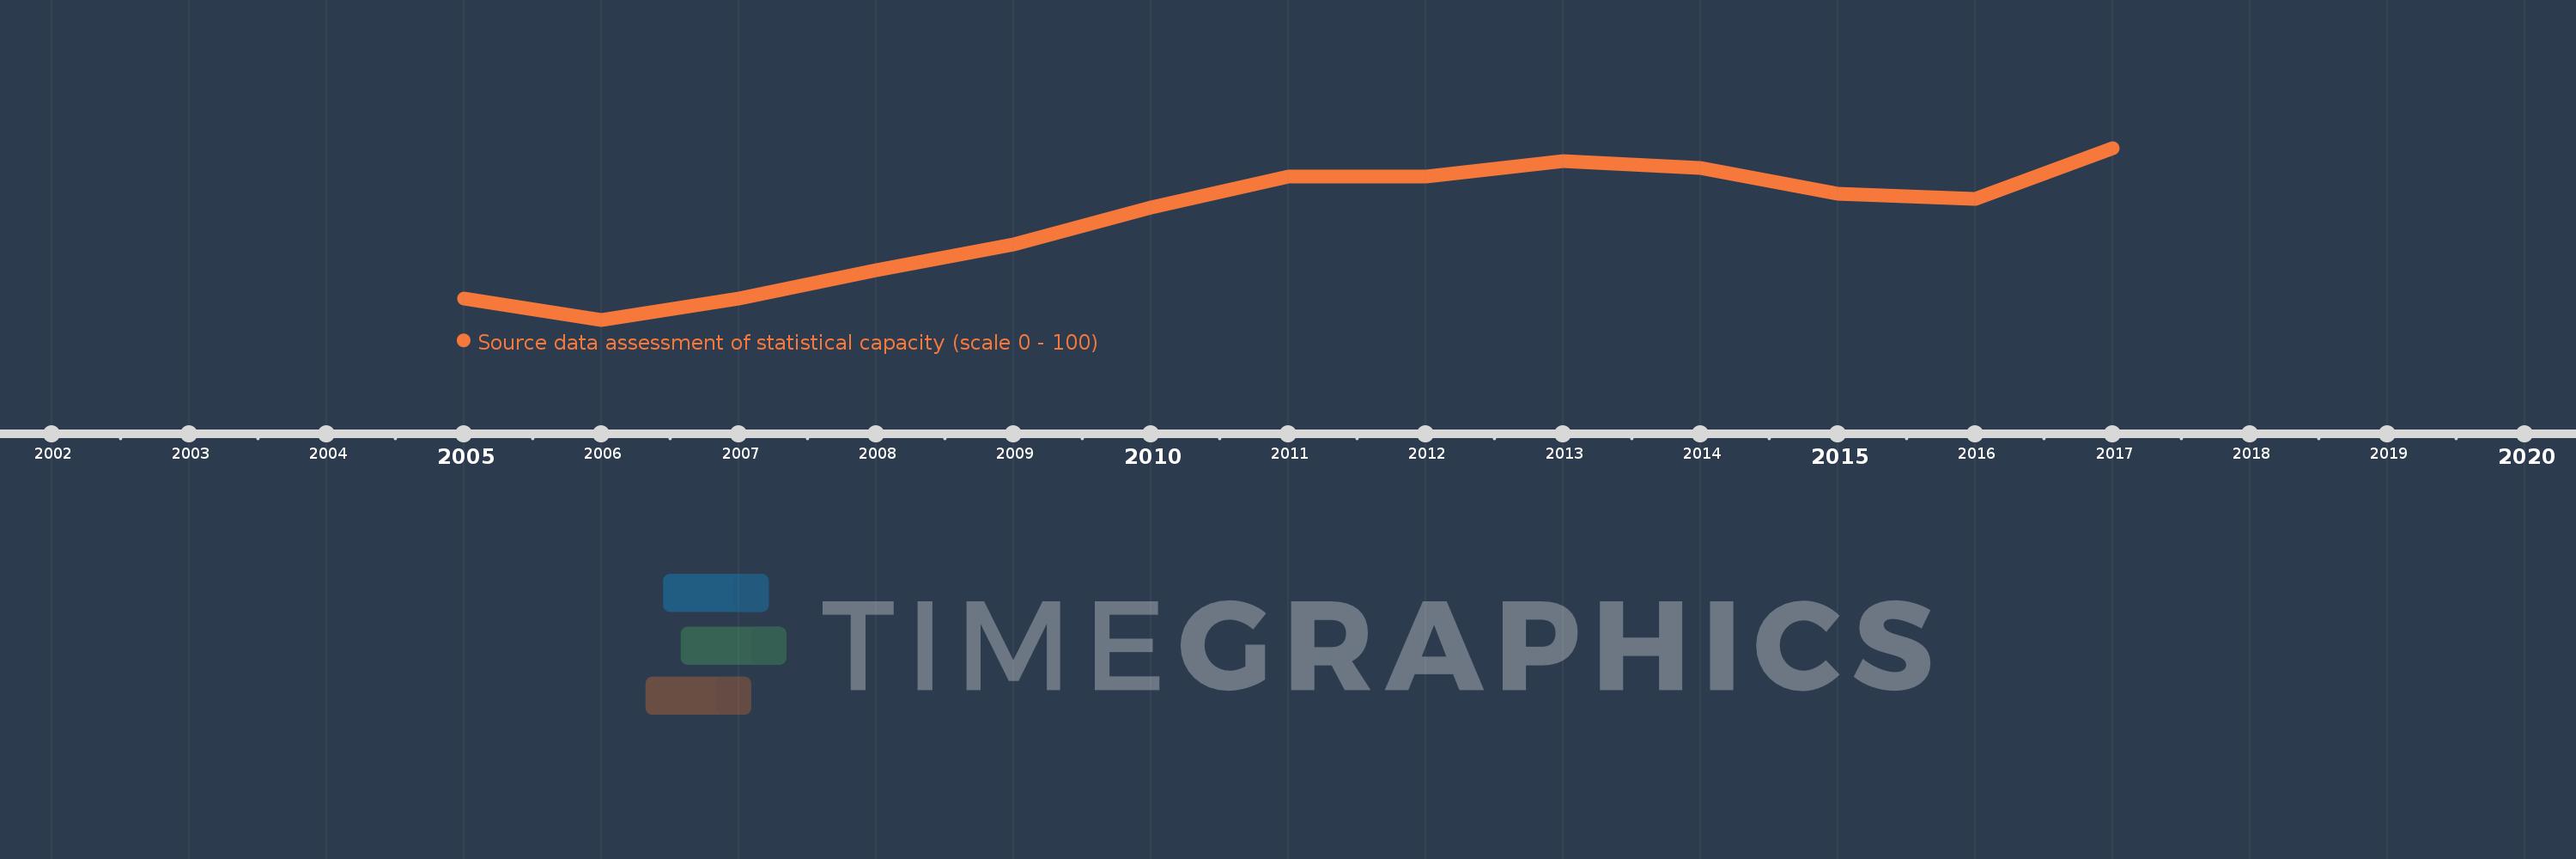
Source data assessment of statistical capacity (scale 0 - 100)
2017,2016,2015,2014,2013,2012,2011,2010,2009,2008,2007,2006,2005
This statistics in other country:
Timeline:
This timeline shows a graph from 2005 to 2017 of Pre-demographic dividend. No data until 2004. Number of actual observations by date: 13.
Source name:
World Development Indicators
Source organization:
World Bank
Categories, topics:
Public Sector
Last updated:
apr 23, 2017
Indicators value changes by year
Minimum:
45.152
jan 1, 2006
Maximum:
54.857
jan 1, 2017
At the date of observation
Value
Absolute change
Change from previous value
jan 1, 2005
46.364
+46.364
0.0%
jan 1, 2006
45.152
-1.212
-2.61%
jan 1, 2007
46.364
+1.212
2.68%
jan 1, 2008
47.941
+1.578
3.4%
jan 1, 2009
49.412
+1.471
3.07%
jan 1, 2010
51.471
+2.059
4.17%
jan 1, 2011
53.235
+1.765
3.43%
jan 1, 2012
53.235
0.0
0.0%
jan 1, 2013
54.118
+0.882
1.66%
jan 1, 2014
53.714
-0.403
-0.75%
jan 1, 2015
52.286
-1.429
-2.66%
jan 1, 2016
52.0
-0.286
-0.55%
jan 1, 2017
54.857
+2.857
5.49%
Ranking of countries by current statistics by years


Comments: